Fig. 11.
Download original image
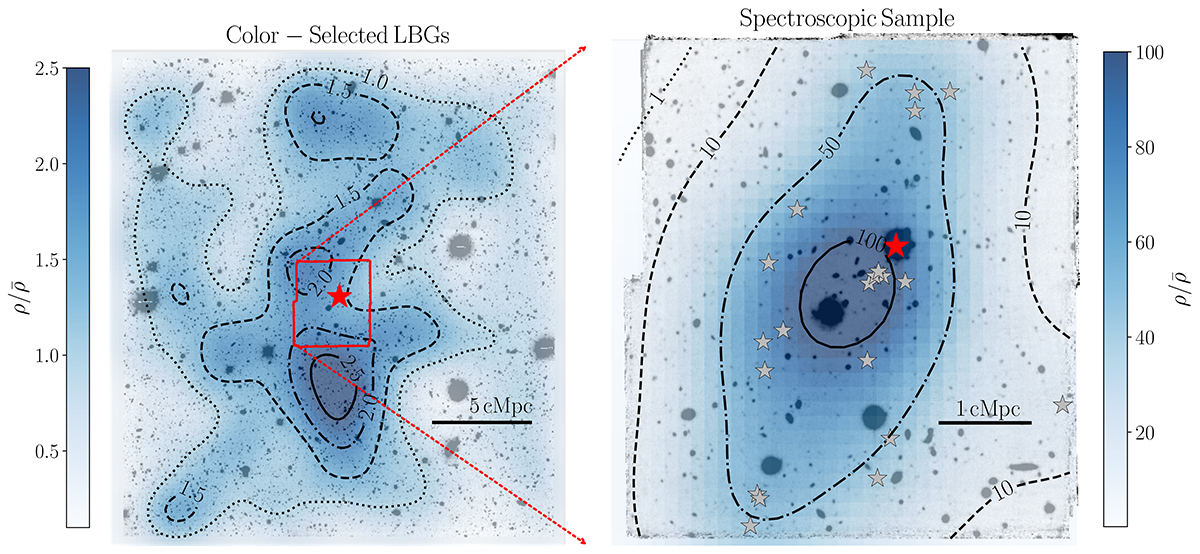
2D overdensity maps of the LBGs and of the spectroscopically selected galaxies found to be clustered with the QSO. Left panel: Overdensity map of the LBGs identified within the 24 × 24 cMpc2 FORS2 FoV. The amplitude of the overdensity is shown in shades of blue scaling with the colormap. Contours are shown for ![]() as solid, dash-dotted, dashed and dotted lines respectively. The central QSO is marked as a red star, and the MUSE FoV is also displayed on top of the FORS2 R-band image. Right panel: zoom in the FoV of the MUSE mosaic, with the white-light image overlaid by the overdensity map of the spectroscopic sample of galaxies identified within |Δv|≤1000 km s−1 (gray stars) around the QSO (red star). Solid, dash-dotted, dashed and dotted contours correspond to
as solid, dash-dotted, dashed and dotted lines respectively. The central QSO is marked as a red star, and the MUSE FoV is also displayed on top of the FORS2 R-band image. Right panel: zoom in the FoV of the MUSE mosaic, with the white-light image overlaid by the overdensity map of the spectroscopic sample of galaxies identified within |Δv|≤1000 km s−1 (gray stars) around the QSO (red star). Solid, dash-dotted, dashed and dotted contours correspond to ![]() . Note the different spatial scaling and that of the colormap in the two panels. North is up.
. Note the different spatial scaling and that of the colormap in the two panels. North is up.
Current usage metrics show cumulative count of Article Views (full-text article views including HTML views, PDF and ePub downloads, according to the available data) and Abstracts Views on Vision4Press platform.
Data correspond to usage on the plateform after 2015. The current usage metrics is available 48-96 hours after online publication and is updated daily on week days.
Initial download of the metrics may take a while.