Open Access
Fig. 10.
Download original image
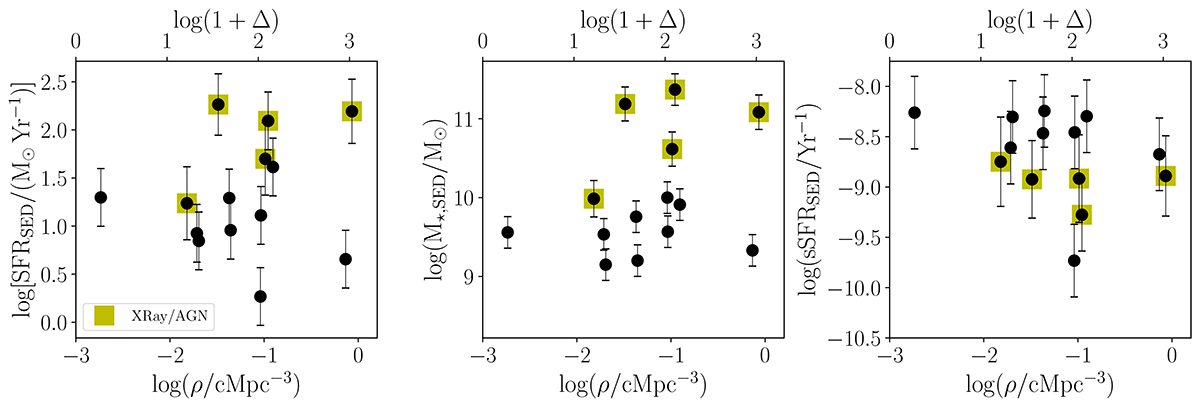
MQN01 galaxies’ SFR (1st panel), stellar mass (2nd panel) and sSFR (3rd panel) as a function of the co-moving local galaxy density (bottom x-axis) and overdensity (top x-axis) with respect to the field. X-Ray emitting AGN detected in Chandra observations are highlighted as yellow squares.
Current usage metrics show cumulative count of Article Views (full-text article views including HTML views, PDF and ePub downloads, according to the available data) and Abstracts Views on Vision4Press platform.
Data correspond to usage on the plateform after 2015. The current usage metrics is available 48-96 hours after online publication and is updated daily on week days.
Initial download of the metrics may take a while.