Fig. 9.
Download original image
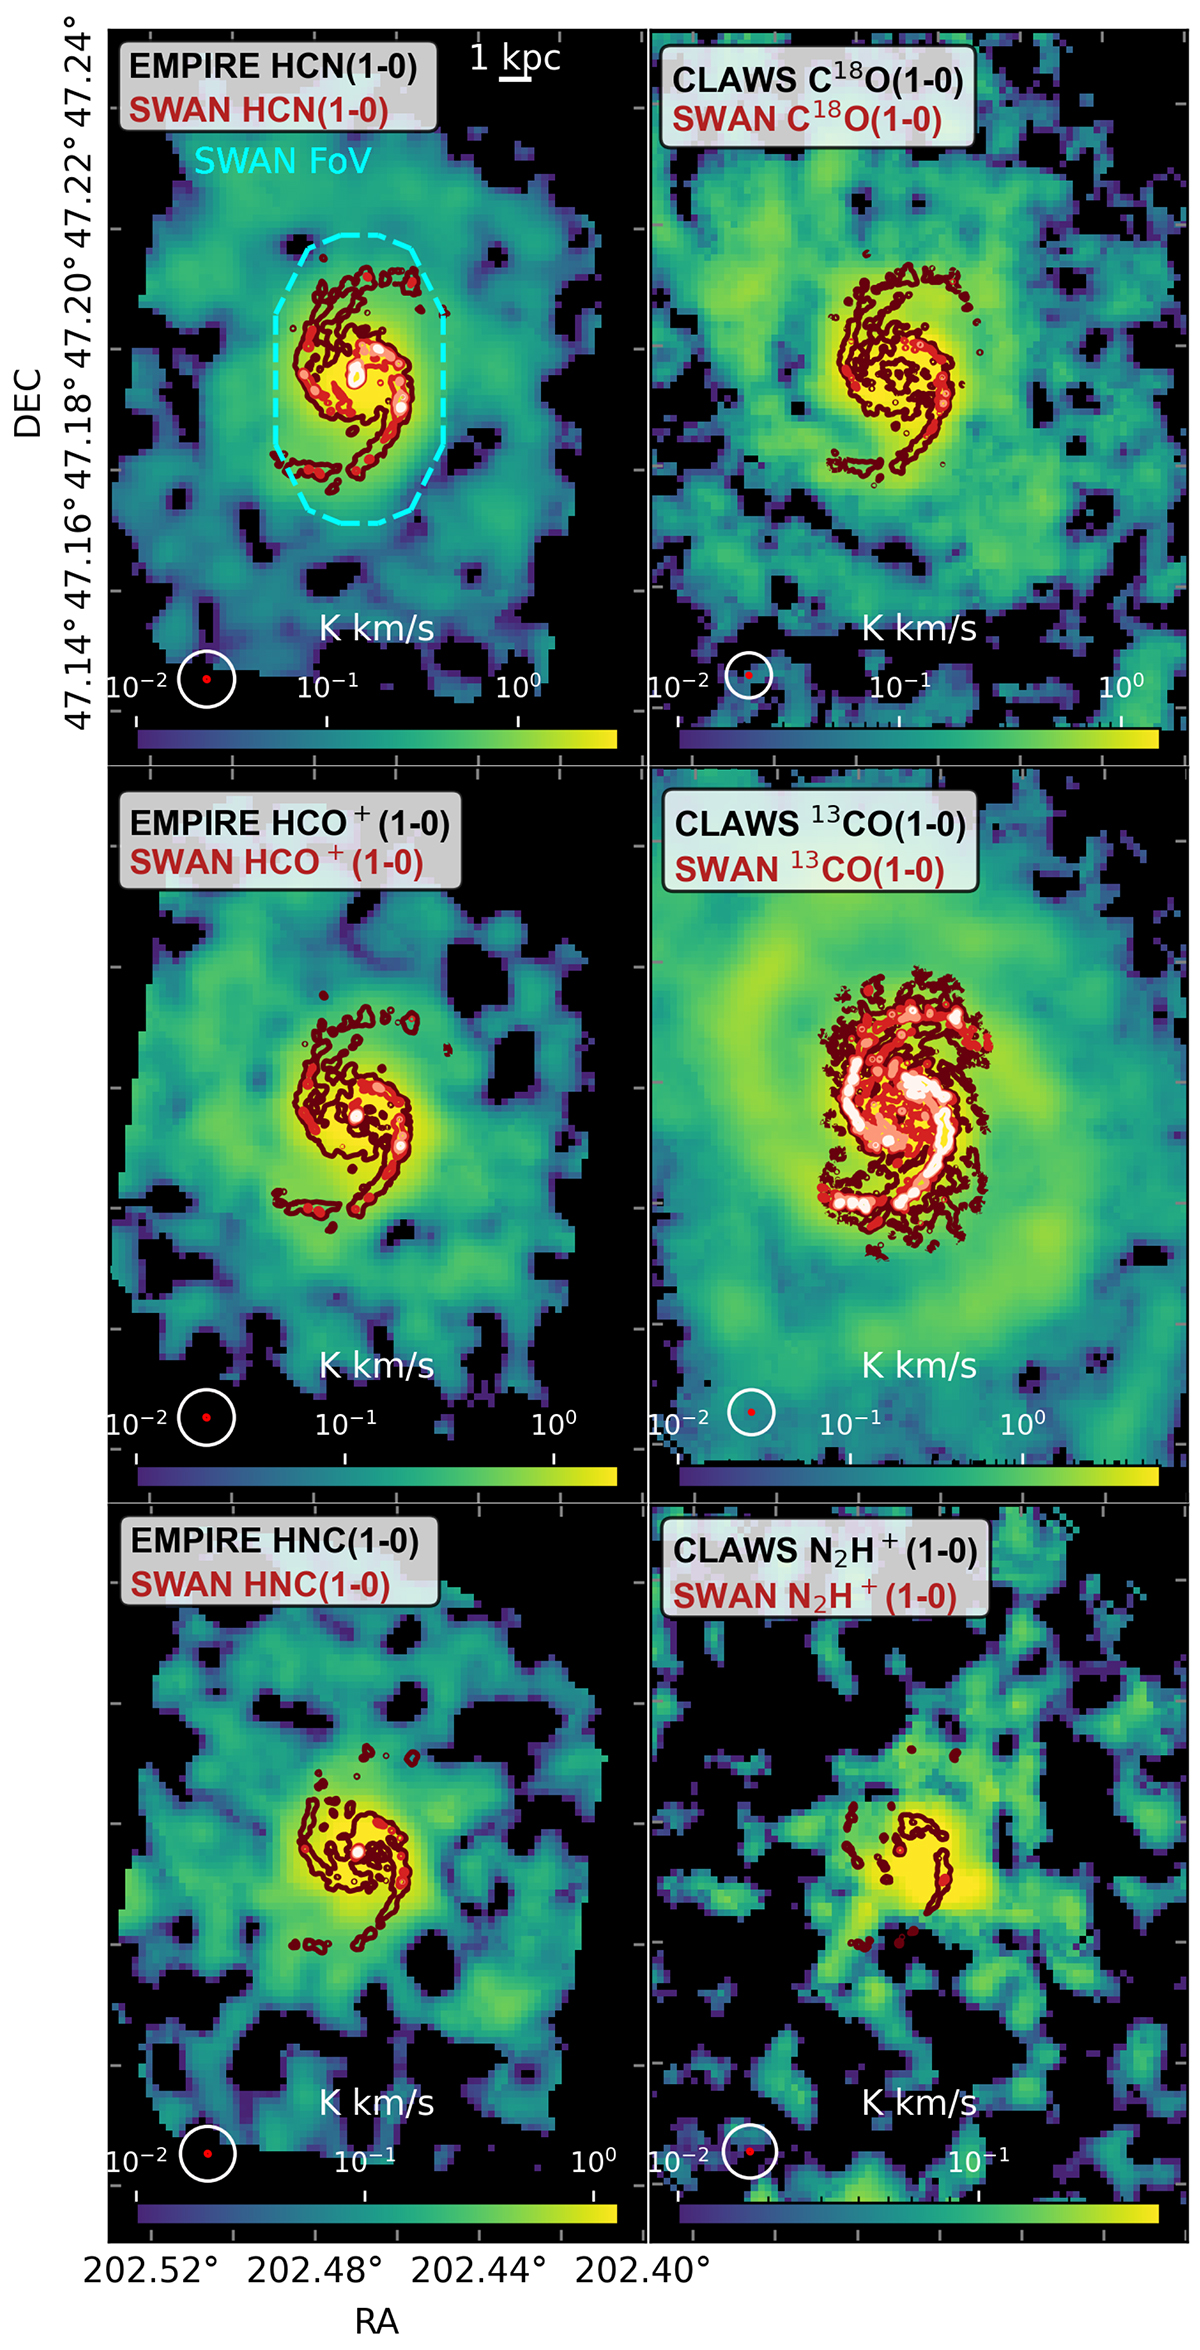
Integrated emission maps (moment-0) from EMPIRE at 33″ for HCN, HCO+, HNC (1−0) (left columns) as well as from CLAWS at 15−30″ resolution for C18O, 13CO and N2H+ (1−0) (right columns) with SWAN 1, 5, 10 and 15 K km s−1 contours at native resolution (∼3″) on top. Beam sizes of EMPIRE/CLAWS and SWAN are shown in the bottom left corner of each panel (white and red circles, respectively).
Current usage metrics show cumulative count of Article Views (full-text article views including HTML views, PDF and ePub downloads, according to the available data) and Abstracts Views on Vision4Press platform.
Data correspond to usage on the plateform after 2015. The current usage metrics is available 48-96 hours after online publication and is updated daily on week days.
Initial download of the metrics may take a while.