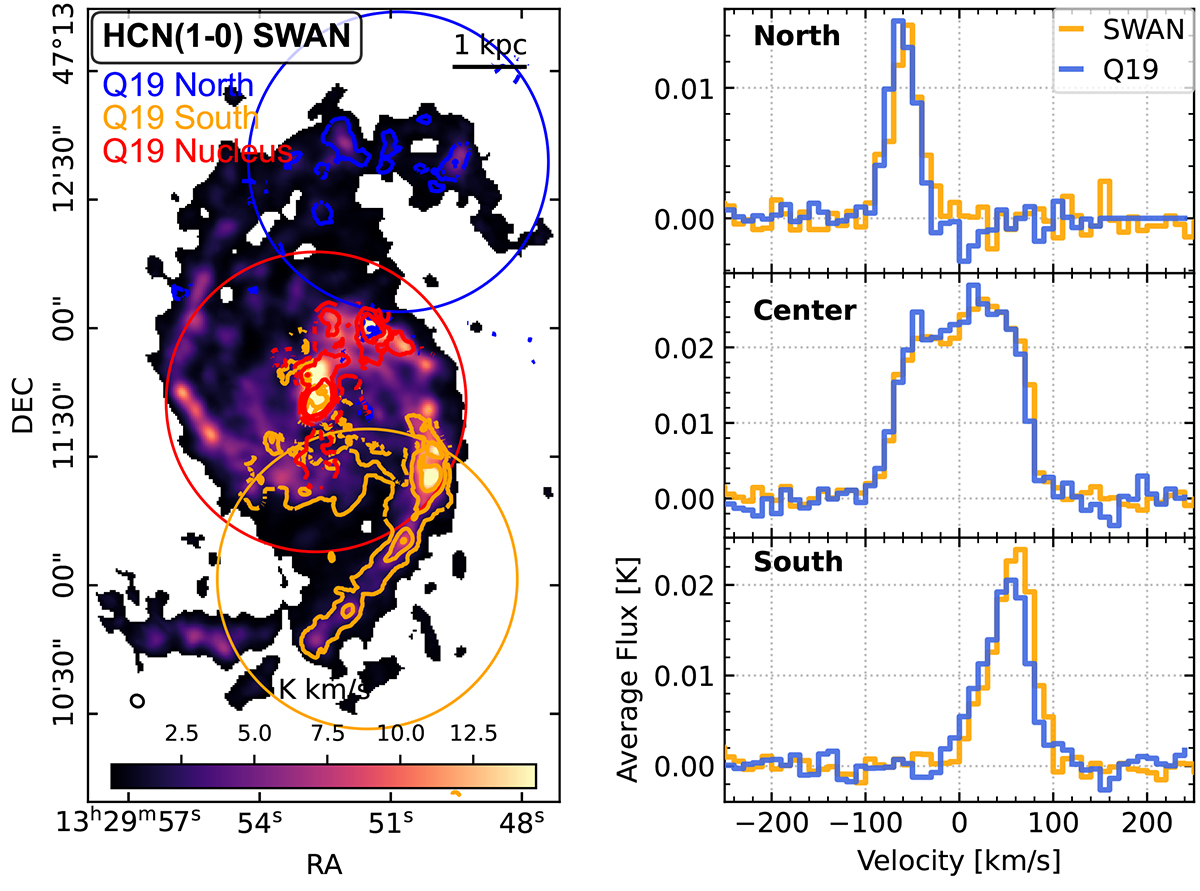
Fig. 8.
Download original image
Comparison with HCN observations from Querejeta et al. (2019) (Q19). Left panel: SWAN HCN moment-0 map with contours (∼5, 50, 200σ with σ the average noise) of Q19 HCN maps. Both maps are at 3″ resolution, spatially and spectrally regridded to the same grid, and the maps were created via the same GILDAS island method (using just the HCN line). Circles depict radii of 35″ centered according to Q19. Right panels: Average spectra of SWAN 3″ data at 10 km s−1 resolution as well as the matched Q19 data. Spectra are the average flux inside of the circular area shown in the left panel.
Current usage metrics show cumulative count of Article Views (full-text article views including HTML views, PDF and ePub downloads, according to the available data) and Abstracts Views on Vision4Press platform.
Data correspond to usage on the plateform after 2015. The current usage metrics is available 48-96 hours after online publication and is updated daily on week days.
Initial download of the metrics may take a while.