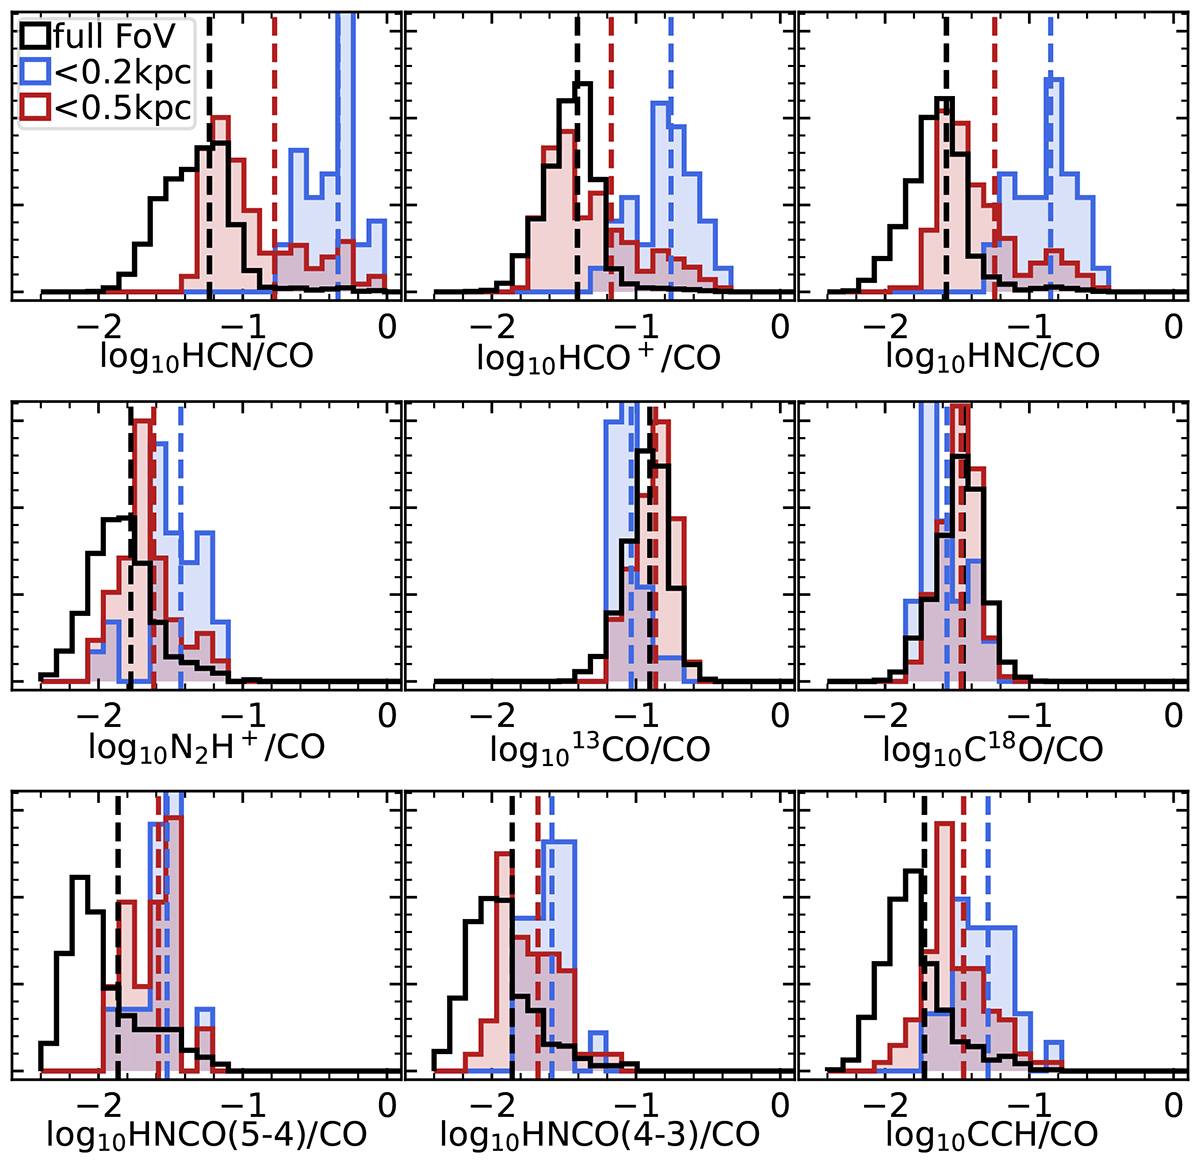
Fig. 7.
Download original image
Histograms of line ratios with 12CO for pixels where both the line emission and 12CO emission are significantly detected (> 3σ) inside the full FoV (black) and the central 1 kpc (blue) and central 0.4 kpc (in diameter, red). We mark averages (log10(mean(line/CO))) for the full FoV and central apertures (dashed gray, blue, and red line, respectively). The histograms are normalized to have an integrated area of unity.
Current usage metrics show cumulative count of Article Views (full-text article views including HTML views, PDF and ePub downloads, according to the available data) and Abstracts Views on Vision4Press platform.
Data correspond to usage on the plateform after 2015. The current usage metrics is available 48-96 hours after online publication and is updated daily on week days.
Initial download of the metrics may take a while.