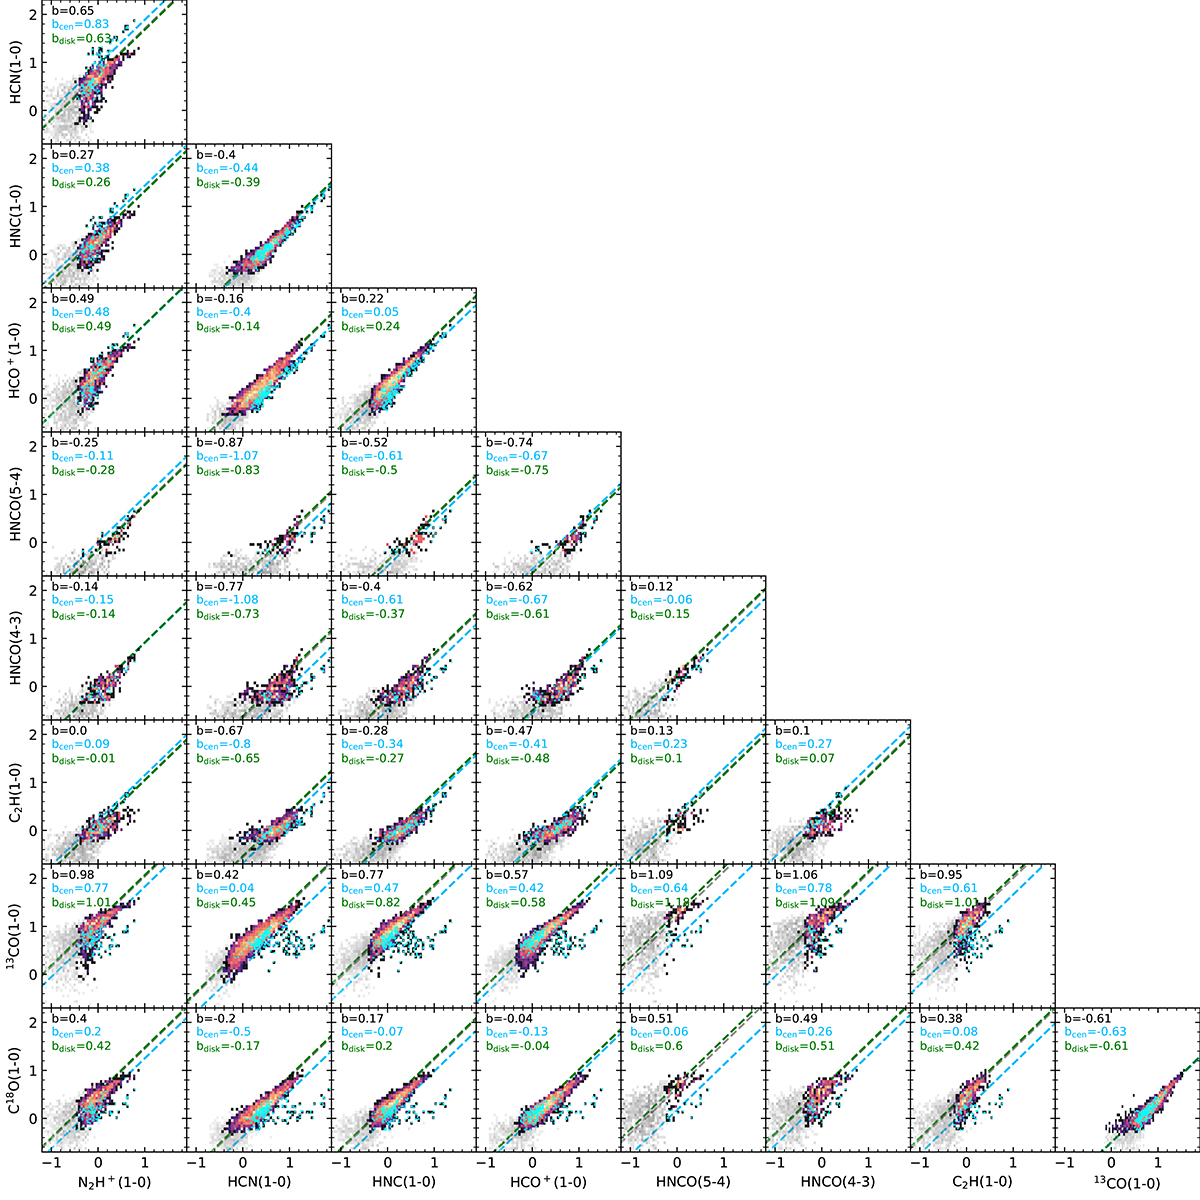
Fig. 6.
Download original image
Logarithmic integrated line emission in K km s−1 of all lines compared on a pixel-by-pixel scale. We show the 2D distribution of emission from both significant detections (colored points, > 3σ) and non-detections (gray points, < 3σ). The color scale of both detected and undetected points indicates the point density and is for visual purposes only. We mark pixels inside the central 1 kpc (in diameter, ∼8″) in cyan. The dashed gray line corresponds to a power-law with a slope of unity and offset b being the average line ratio calculated from pixels with significant detections, including the central pixels. We define b = mean(log10(y/x)), with x and y referring to the values on the x and y axes. We further show bcen (dashed blue line) and bdisk (dashed green line) which were calculated using only pixels inside and outside the central 1 kpc, respectively. bdisk and b often overlap. Uncertainties were calculated following Gaussian error propagation and are listed together with all values of b in Table D.1.
Current usage metrics show cumulative count of Article Views (full-text article views including HTML views, PDF and ePub downloads, according to the available data) and Abstracts Views on Vision4Press platform.
Data correspond to usage on the plateform after 2015. The current usage metrics is available 48-96 hours after online publication and is updated daily on week days.
Initial download of the metrics may take a while.