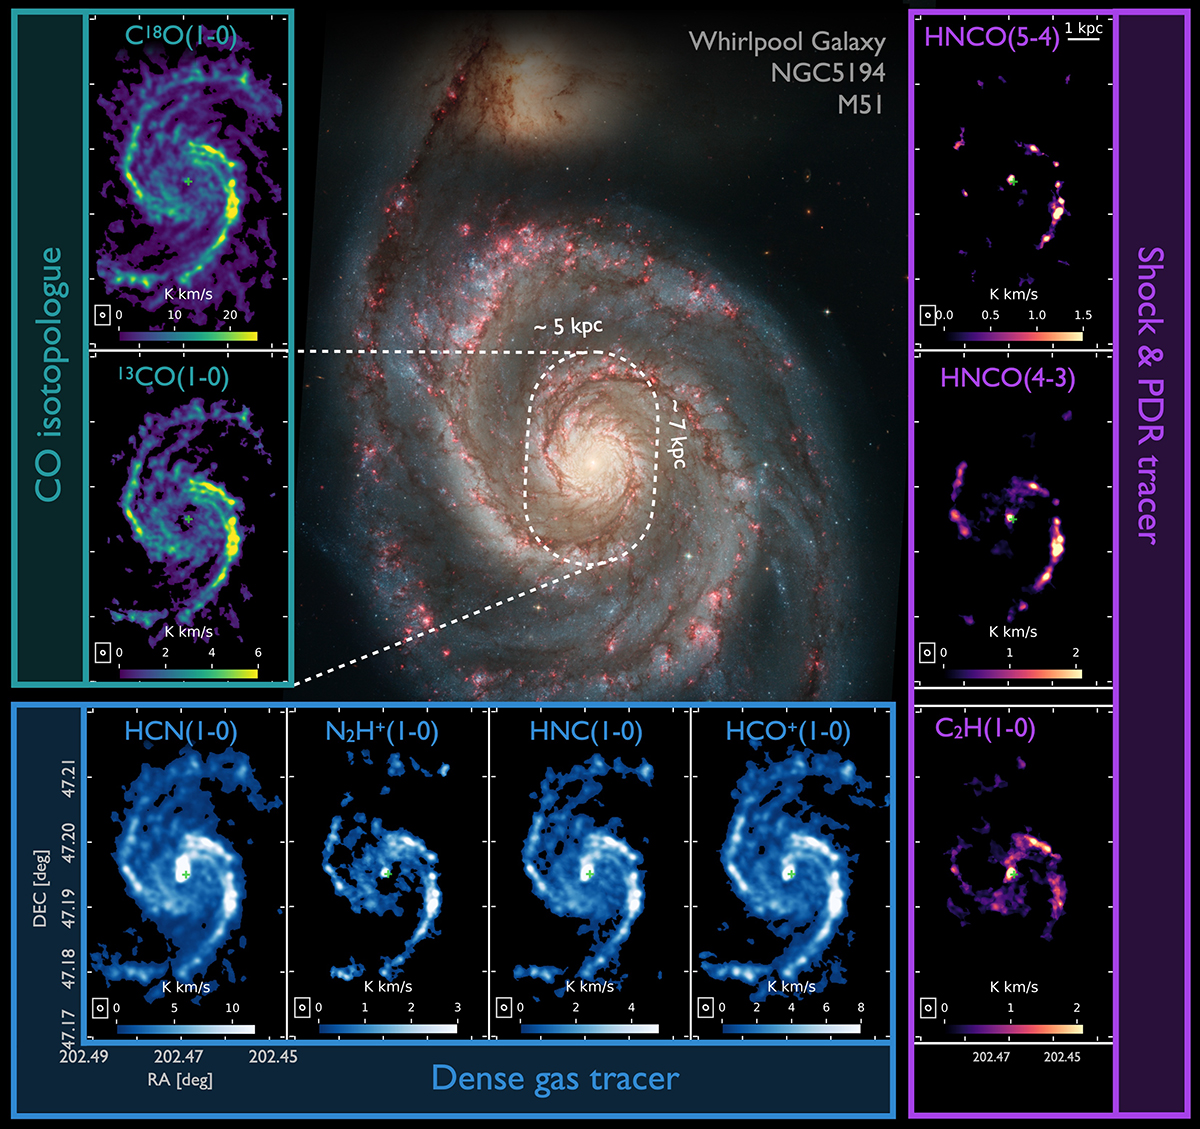
Fig. 5.

Download original image
Integrated intensity (moment-0) maps of the SWAN dataset (combined NOEMA and IRAM 30m observations) for the J = 1 − 0 transitions of 13CO, C18O, N2H+, HCO+, HNC, HCN, and C2H plus HNCO(J = 4 − 3) and HNCO(J = 5 − 4) at their native angular resolution (∼2.3 − 3.1″). The lines are grouped in different subsets based on their commonly used applications. The maps were created with the GILDAS Island-method (see Appendix C). We show the beam size in the bottom left of all panels as well as a 1 kpc scale bar in the top right panel. The outline of the SWAN FoV is indicated by a dashed ellipse on top of a multicolor HST image (credit: S. Beckwith (STScI) Hubble Heritage Team, (STScI/AURA), ESA, NASA).
Current usage metrics show cumulative count of Article Views (full-text article views including HTML views, PDF and ePub downloads, according to the available data) and Abstracts Views on Vision4Press platform.
Data correspond to usage on the plateform after 2015. The current usage metrics is available 48-96 hours after online publication and is updated daily on week days.
Initial download of the metrics may take a while.


