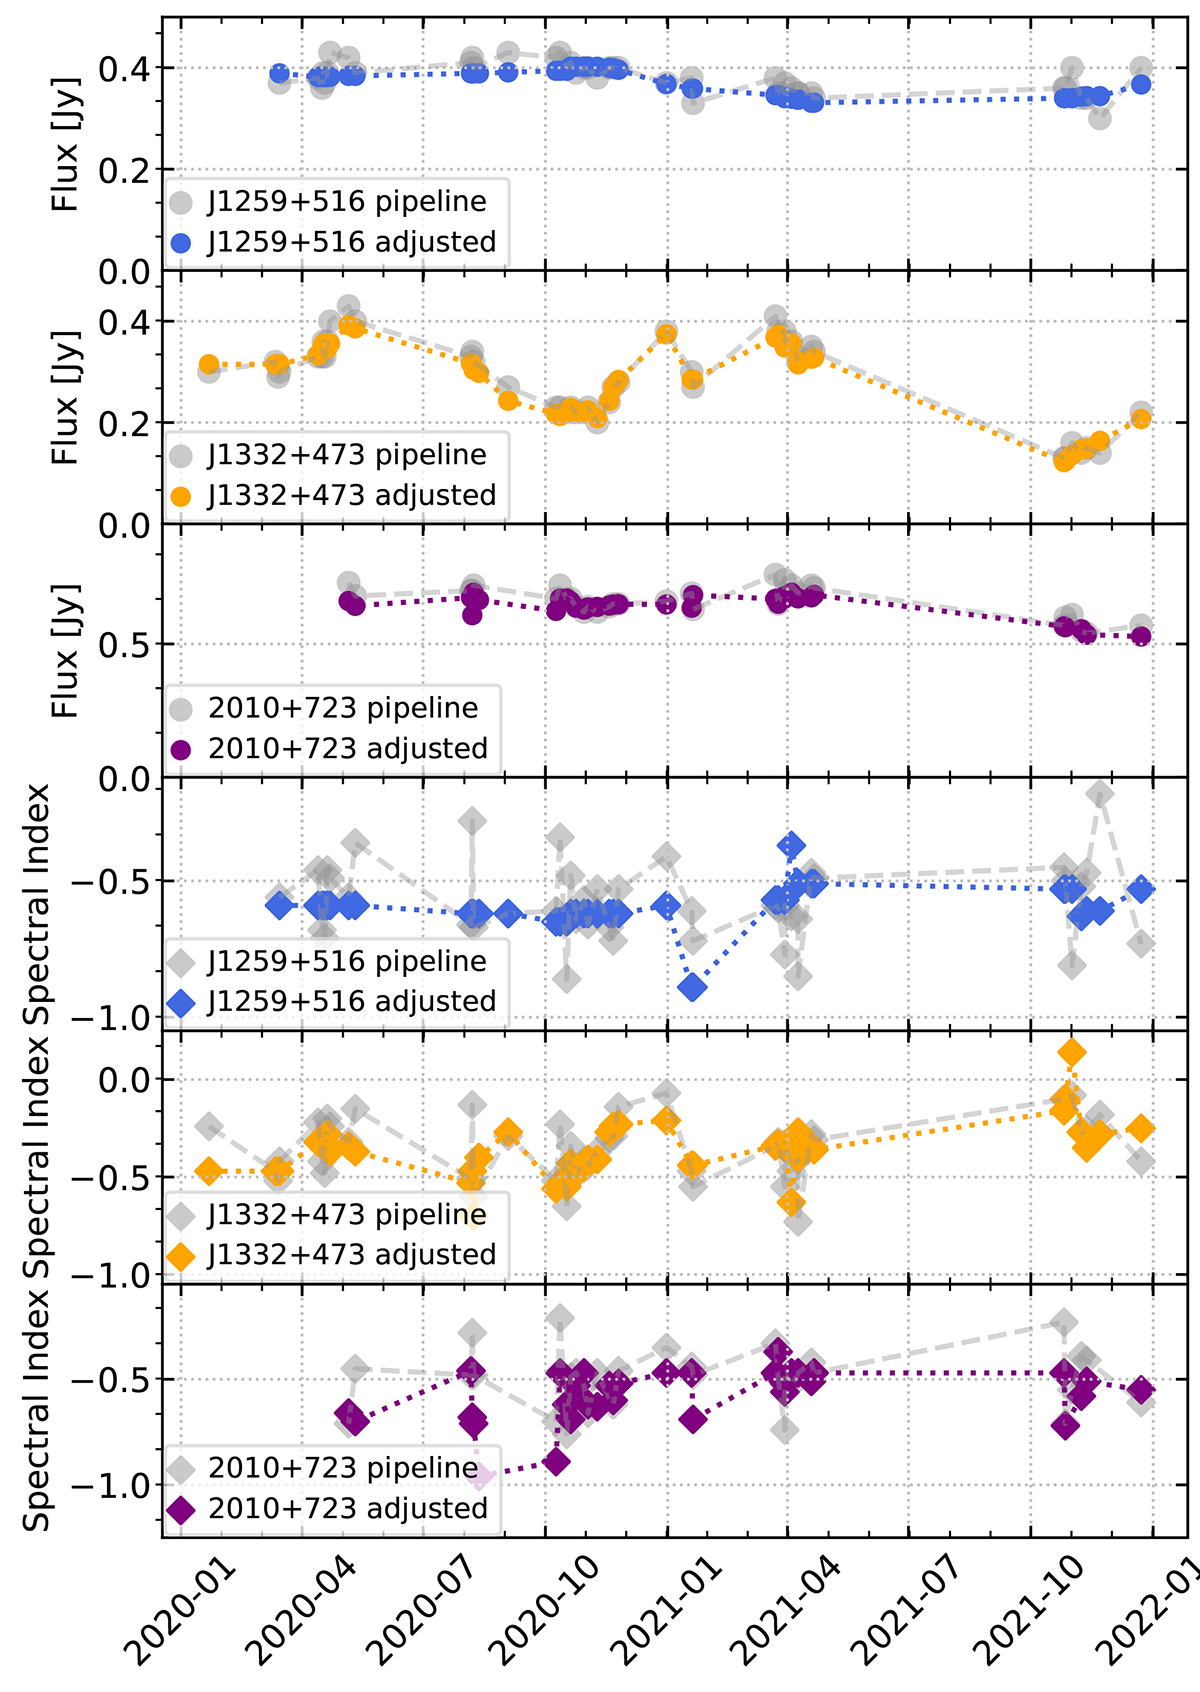
Fig. 2.
Download original image
Observed flux (top three rows) and spectral index (bottom three rows) over time for the three used phase and amplitude calibrators of the SWAN NOEMA observations. In addition to the adopted solution (colored points), we show the flux solution determined by the pipeline (gray circles). The temporal variation in the flux of these quasars is relatively smooth. Manual adjustments result in smaller time variations in the spectral index.
Current usage metrics show cumulative count of Article Views (full-text article views including HTML views, PDF and ePub downloads, according to the available data) and Abstracts Views on Vision4Press platform.
Data correspond to usage on the plateform after 2015. The current usage metrics is available 48-96 hours after online publication and is updated daily on week days.
Initial download of the metrics may take a while.