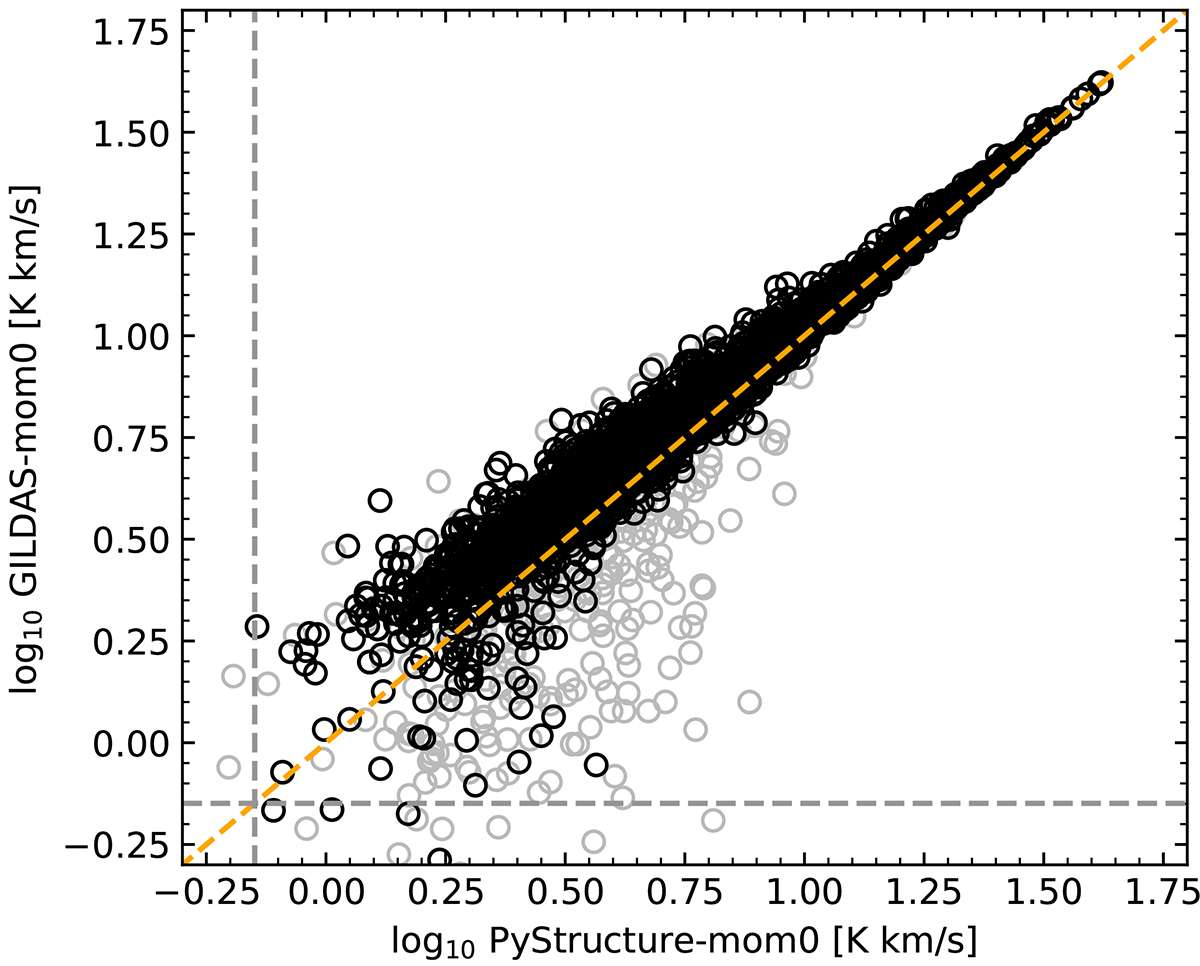
Fig. C.3.
Download original image
Pixel-by-pixel comparison of the obtained integrated line emission using two different methods for the 10 km s−1 resolution 13CO data cube at native angular resolution. We show pixels located inside (black circles) and outside (gray circles) the hull of the mosaics (compare this with Fig. 1). We show the 1:1 relation (dashed orange line). We mark the average 5σ noise level for both lines (dashed gray line). We note that due to logarithmic spacing, data points containing noise with negative fluxes are not visible. Although this applies to most data points in the interarm region near the edges of our FoV, we emphasize that this comparison is intended to assess how both methods handle regions with significant detected emission, as these areas are typically the focus of scientific analysis. Regions with significantly detected emission is found mostly in the center, the molecular ring, and on the spiral arms.
Current usage metrics show cumulative count of Article Views (full-text article views including HTML views, PDF and ePub downloads, according to the available data) and Abstracts Views on Vision4Press platform.
Data correspond to usage on the plateform after 2015. The current usage metrics is available 48-96 hours after online publication and is updated daily on week days.
Initial download of the metrics may take a while.