Fig. C.2.
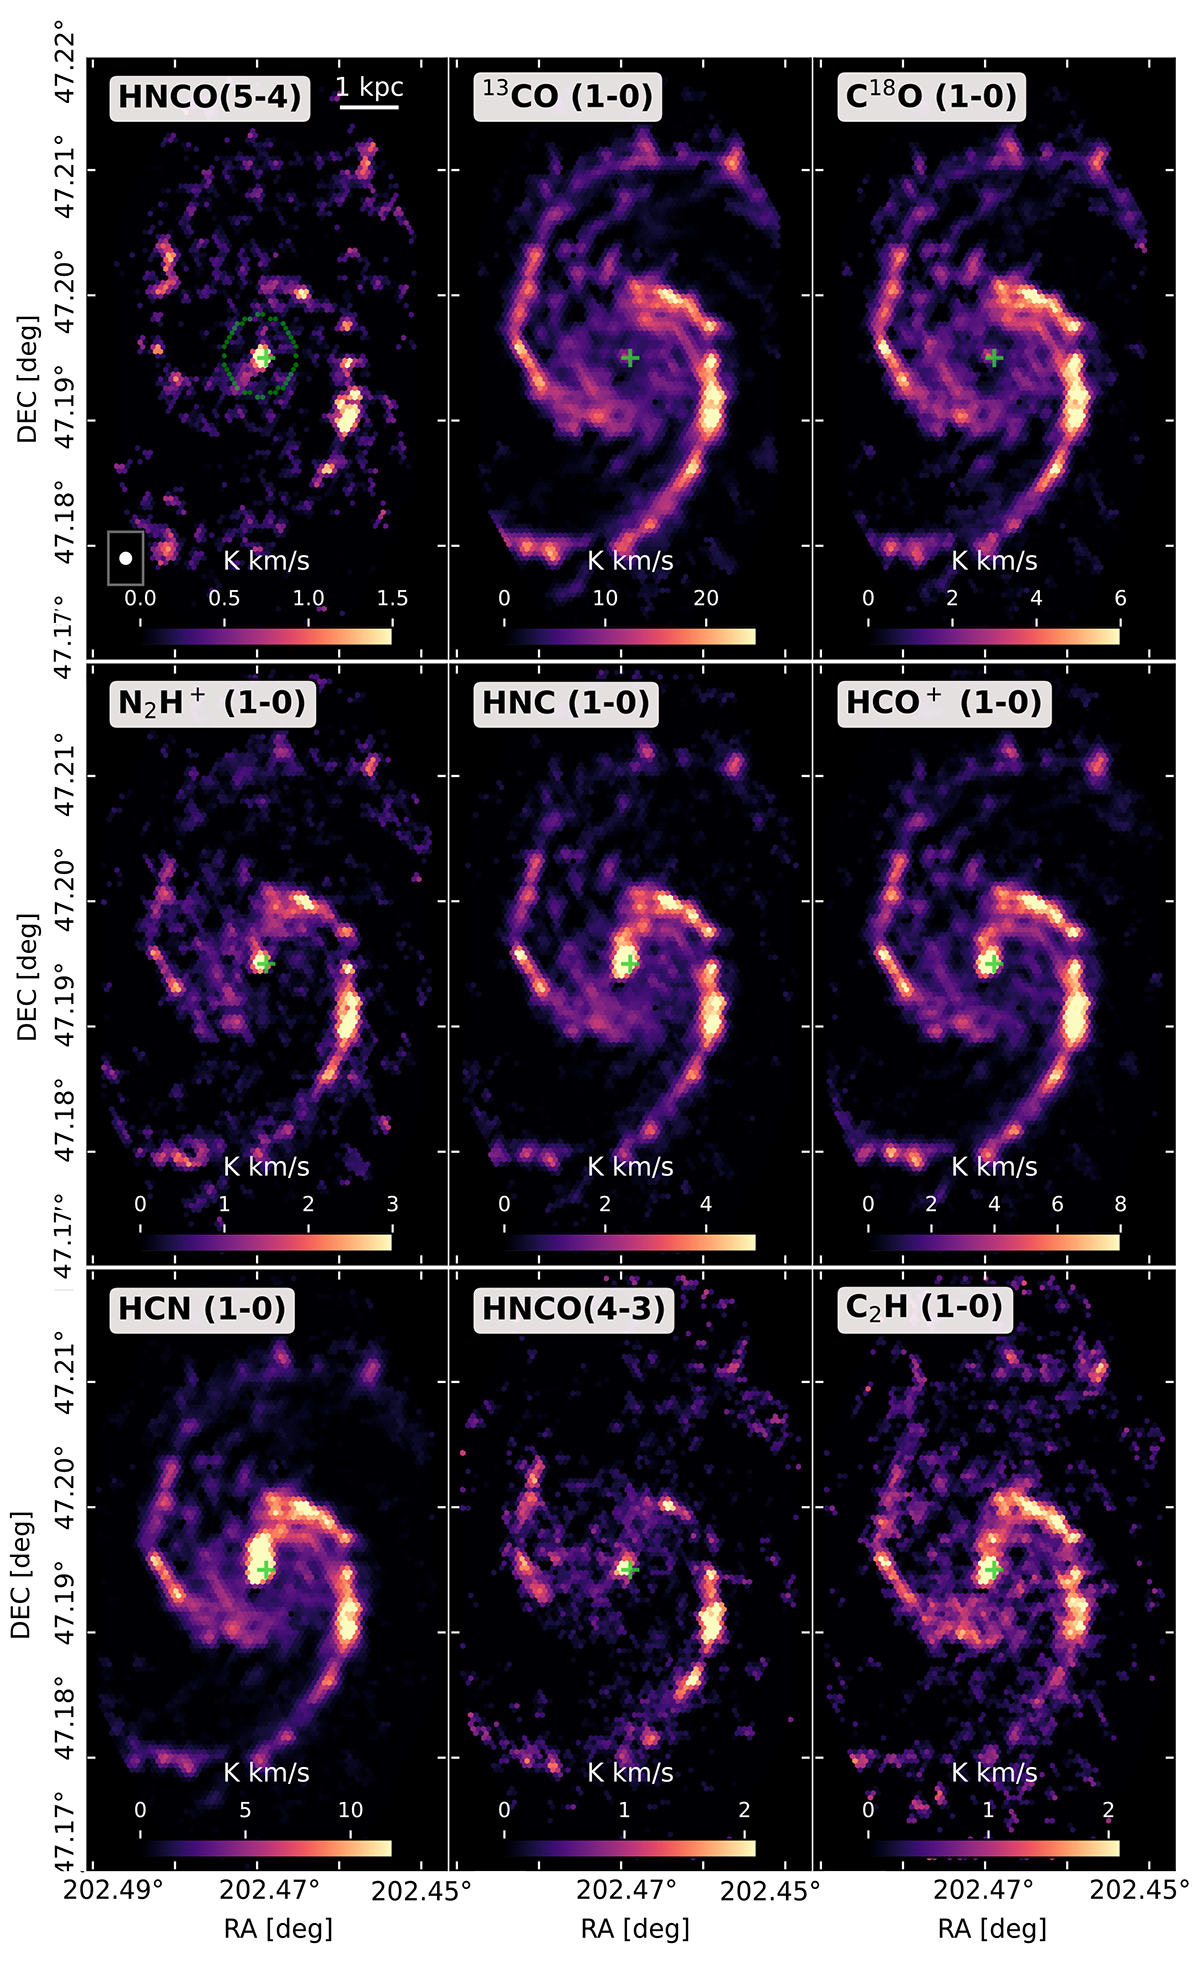
Download original image
Integrated intensity maps (moment-0) of the SWAN dataset (combined NOEMA and IRAM 30m observations) for all detected lines at a common resolution of 3″ (125 pc). The data is binned with hexagonal spacing with the PyStructure code (den Brok et al. 2022; Neumann et al. 2023). Spectral windows for the creation of the moment maps are selected based on significant detections of 12CO emission from PAWS (Schinnerer et al. 2013) and HCN(1-0) emission. We show the beam size, a 1 kpc scale bar and mark the central 1 kpc circular area (green points) in the top left panel. The intensity scale is the same as in Fig. C.1.
Current usage metrics show cumulative count of Article Views (full-text article views including HTML views, PDF and ePub downloads, according to the available data) and Abstracts Views on Vision4Press platform.
Data correspond to usage on the plateform after 2015. The current usage metrics is available 48-96 hours after online publication and is updated daily on week days.
Initial download of the metrics may take a while.