Fig. A.1.
Download original image
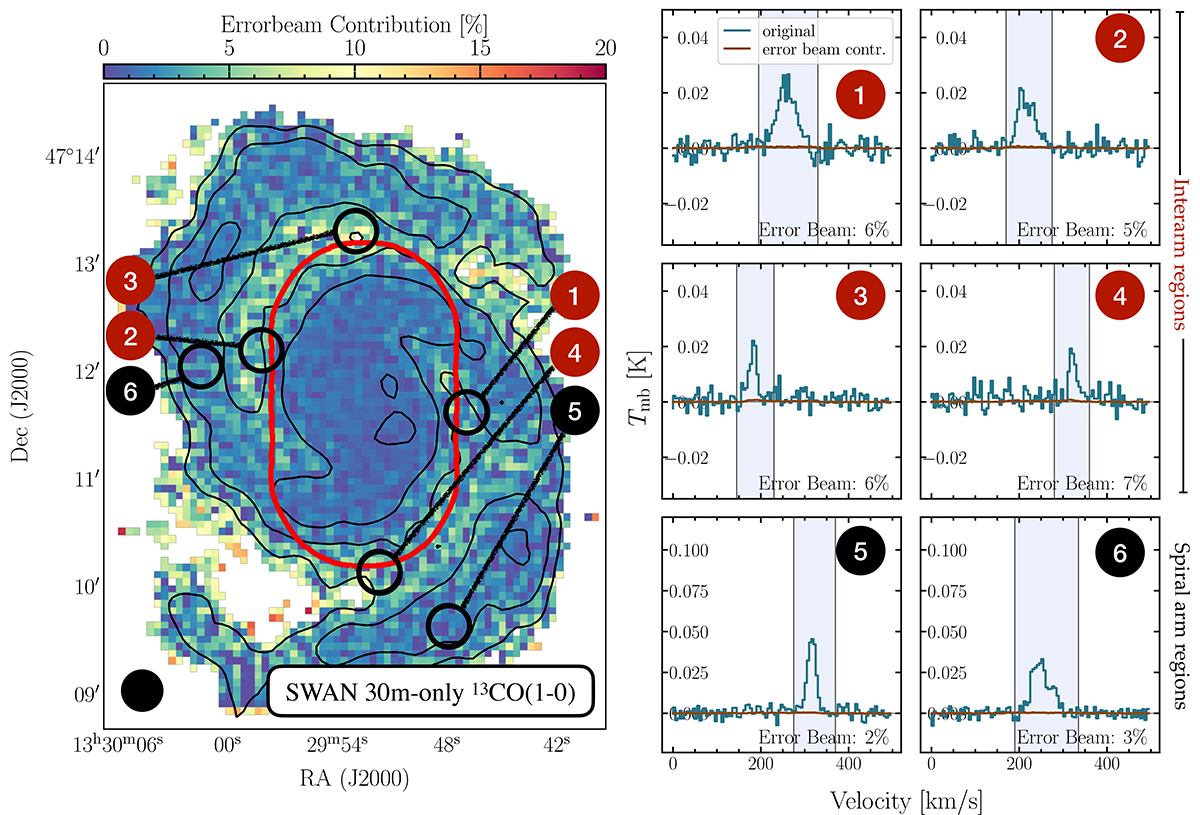
Quantifying errorbeam contributions to the observed 13CO(1–0) emission. (Left) The map presents the percentage errorbeam contribution to individual sightlines for the 30m only data. We only consider sightlines where the integrated 13CO(1–0) brightness temperature is detected at ≳3σ. Contours indicate the S/N at 5,10,20, and 50. The red contour illustrates the SWAN FoV. Overall, the error beam contribution is marginal, with elevated values up to 10% within the interarm region (and < 5% within the SWAN FoV). (Right) We extract 13CO(1–0) spectra in six individual apertures. Apertures 1–4 are in the interarm region and apertures 5–6 in the spiral arms of M51. Each panel shows the full spectrum which includes the contribution from the error beam in blue. The brown spectrum represents the error beam contribution and was calculated by subtracting the error beam free spectrum from the observed spectrum. The percentage contribution is computed over the spectral range where we detect emission (indicated by the blue-shaded region) and is listed in each panel.
Current usage metrics show cumulative count of Article Views (full-text article views including HTML views, PDF and ePub downloads, according to the available data) and Abstracts Views on Vision4Press platform.
Data correspond to usage on the plateform after 2015. The current usage metrics is available 48-96 hours after online publication and is updated daily on week days.
Initial download of the metrics may take a while.