Fig. 1.
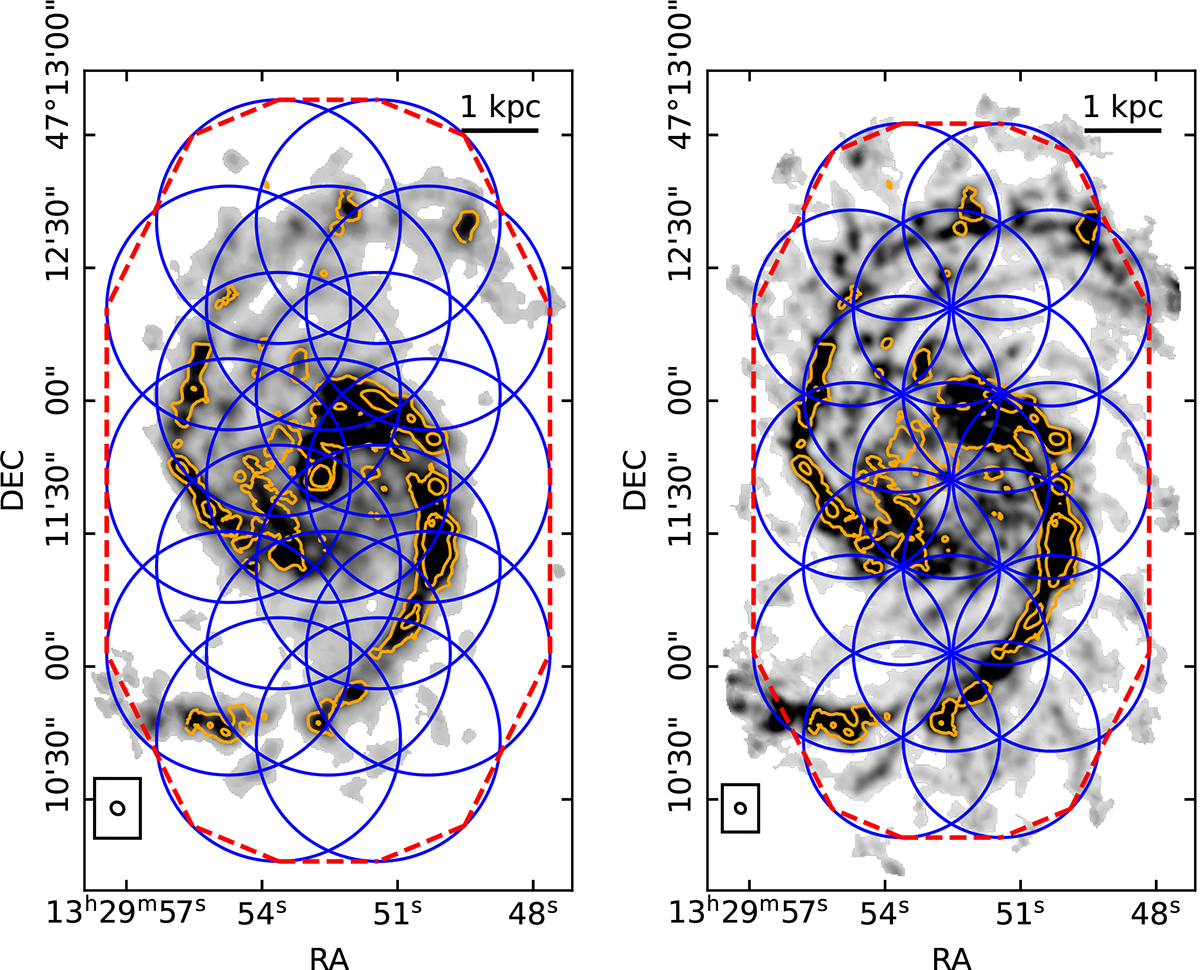
Download original image
Primary beam of individual mosaic pointings (blue circles) of the NOEMA observations for SWAN overlaid on a map of the integrated intensity of HCN(1−0) emission (left) and 13CO(1−0) emission (right). Contours represent integrated N2H+ emission at 0.5 and 2 K km s−1. The pointings shown have a radius of ∼28″ (HCN) and ∼22.5″ (13CO, our highest frequency detected line). We interpolate the outer edges of the individual mosaic pointings to define the area inside which we measure the integrated flux of each observed emission line (red line). Because the primary beam changes with frequency, so does the area used to calculate the line flux.
Current usage metrics show cumulative count of Article Views (full-text article views including HTML views, PDF and ePub downloads, according to the available data) and Abstracts Views on Vision4Press platform.
Data correspond to usage on the plateform after 2015. The current usage metrics is available 48-96 hours after online publication and is updated daily on week days.
Initial download of the metrics may take a while.