Fig. 1.
Download original image
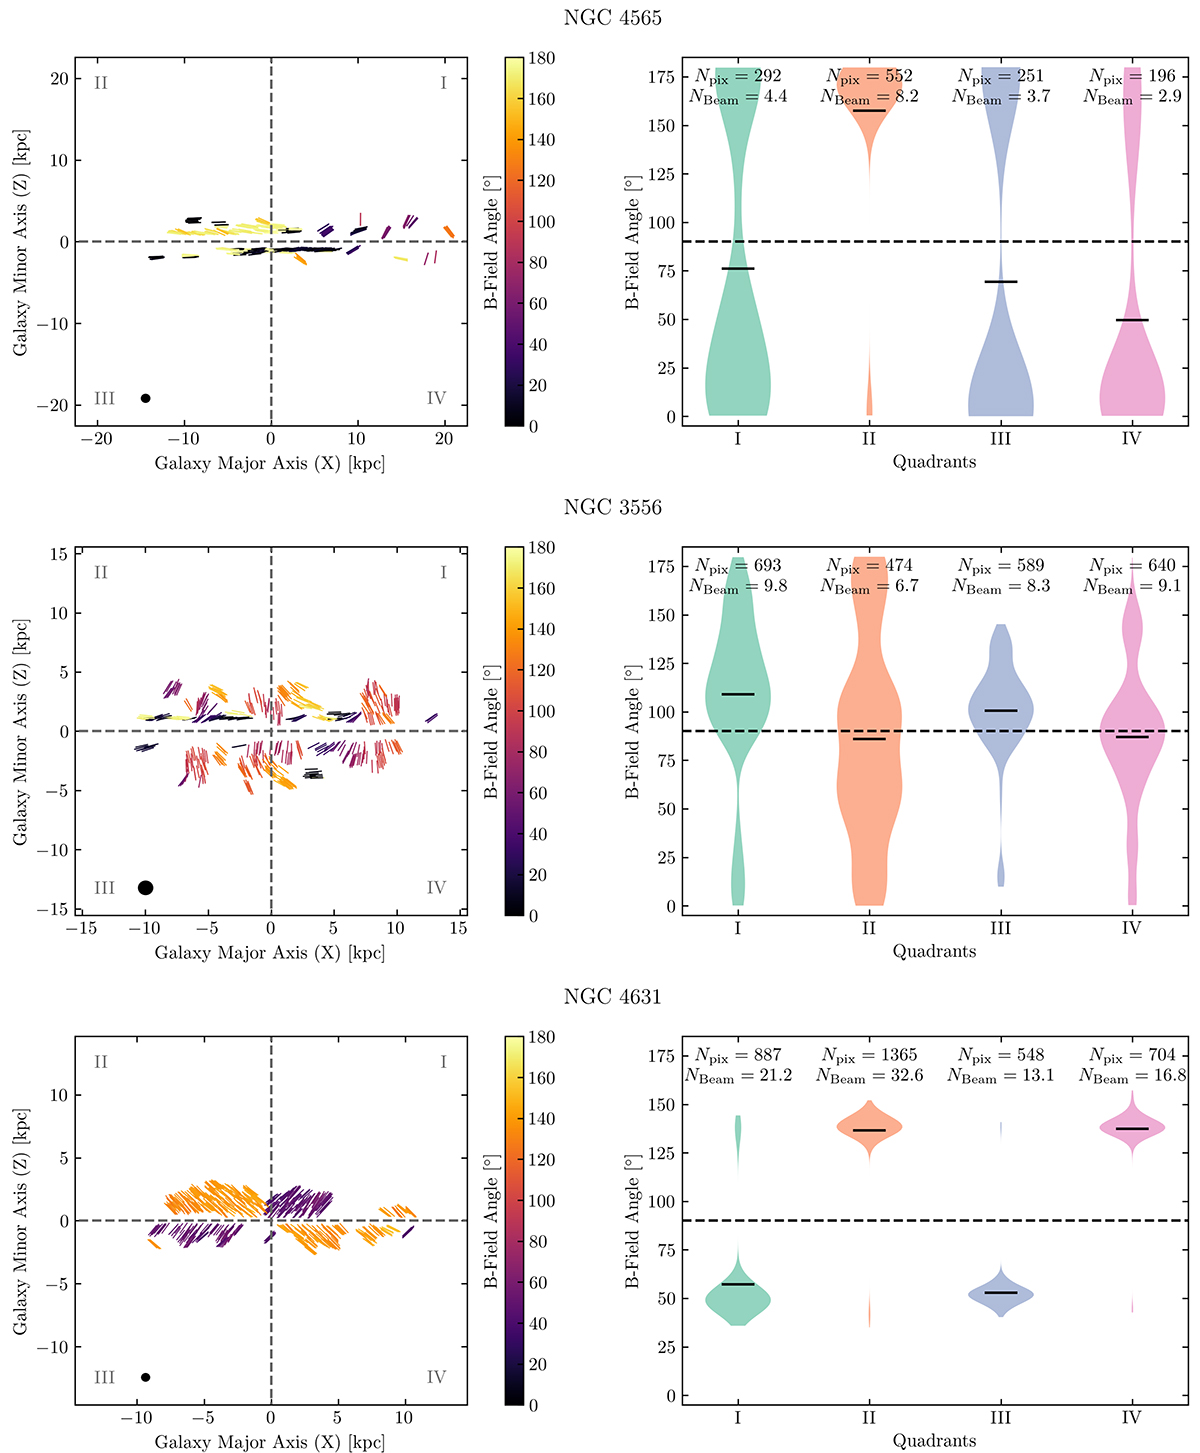
Plots used for the polarisation pattern classification of NGC 4565 (top row), NGC 3556 (middle row), and NGC 4631 (bottom row). Left: Rotated and masked χ-maps, displaying five lines per beam. Quadrant labels and separation lines are displayed in grey. The size of the radio beam is indicated as a black circle in the bottom left corner. Right: Visualisation of the pol. ang. distribution in each quadrant as a violin plot. The horizontal dashed line indicates a B field angle of 90° (perpendicular to the galactic disc). The solid black lines in the violin patterns indicate the mean of the distribution in each quadrant. On top, the number of pixels and beams in each quadrant is displayed. The number of beams is computed by dividing the number of not-masked pixels per quadrant by the number of pixels per beam.
Current usage metrics show cumulative count of Article Views (full-text article views including HTML views, PDF and ePub downloads, according to the available data) and Abstracts Views on Vision4Press platform.
Data correspond to usage on the plateform after 2015. The current usage metrics is available 48-96 hours after online publication and is updated daily on week days.
Initial download of the metrics may take a while.