Fig. A.2
Download original image
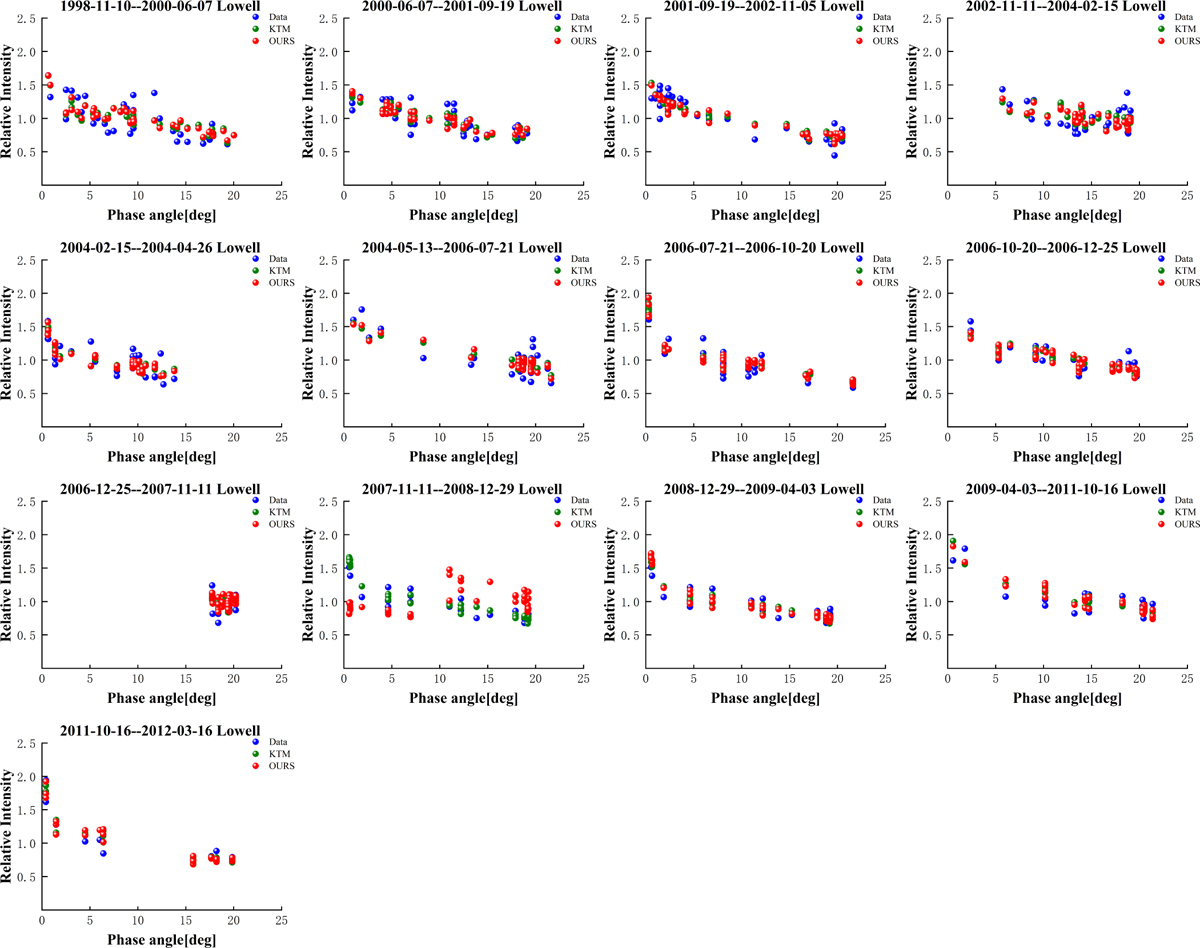
Light curve fitting results of the 3D model of asteroid 1289 Kutaïssi obtained by KTM (Kaasalainen & Torppa 2001) and our method, which was collected from the Lowell Observatory between November 10, 1998, and March 16, 2012. We indicate the time period of the observational data above each chart. The blue points represent the observational data, the green points represent the simulated brightness from the inverted model using the KTM, and the red points represent the simulated brightness from the inverted model using our method. The horizontal axis represents the phase angle, while the vertical axis represents the relative brightness.
Current usage metrics show cumulative count of Article Views (full-text article views including HTML views, PDF and ePub downloads, according to the available data) and Abstracts Views on Vision4Press platform.
Data correspond to usage on the plateform after 2015. The current usage metrics is available 48-96 hours after online publication and is updated daily on week days.
Initial download of the metrics may take a while.