Open Access
Fig. 16
Download original image
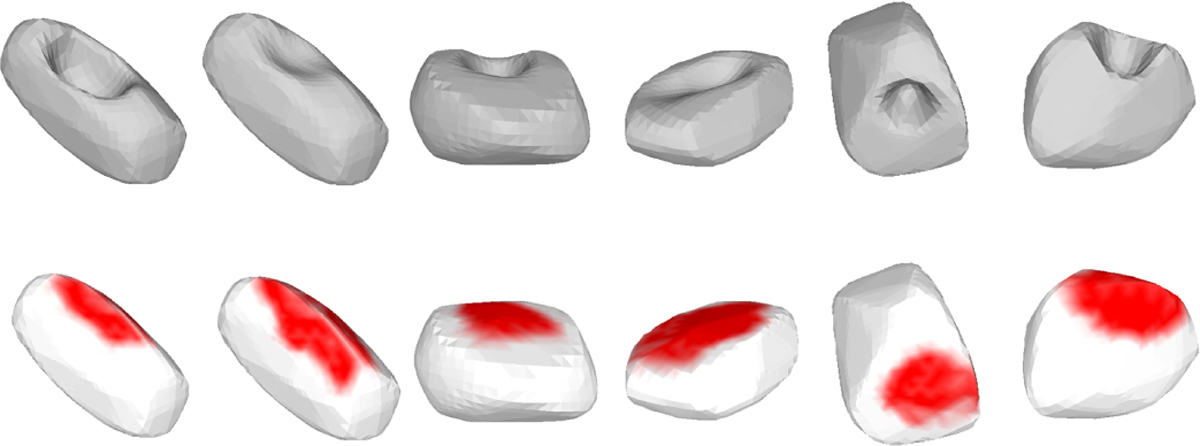
Prediction results of non-convex areas under real observation conditions. The top shows the true non-convex model, and the bottom shows the prediction results on the convex hull, with the red color indicating the predicted concave area.
Current usage metrics show cumulative count of Article Views (full-text article views including HTML views, PDF and ePub downloads, according to the available data) and Abstracts Views on Vision4Press platform.
Data correspond to usage on the plateform after 2015. The current usage metrics is available 48-96 hours after online publication and is updated daily on week days.
Initial download of the metrics may take a while.