Open Access
Fig. 11
Download original image
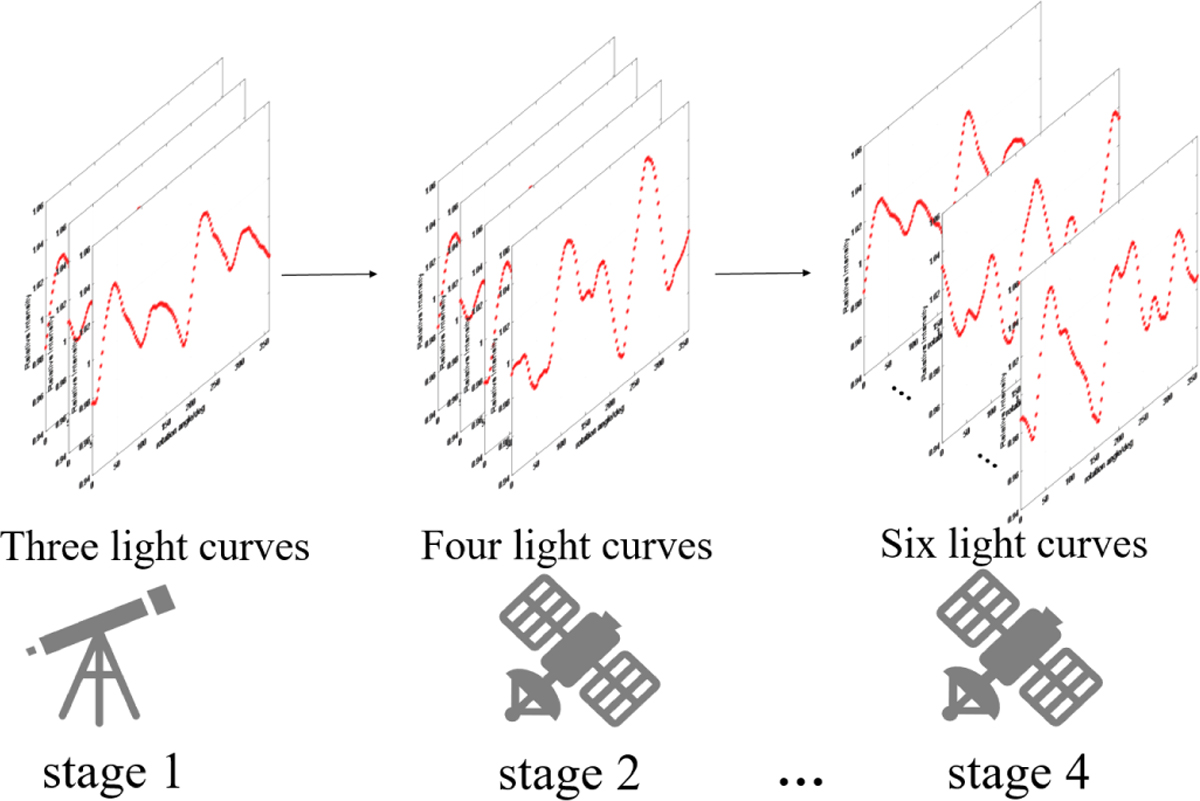
Schematic of the simulated approach detection. Using telescopes on the ground and optical payloads on the spacecraft after launch, the light curve data increases gradually during the approach process, starting with three light curves in Stage 1 and adding one additional light curve at each subsequent stage.
Current usage metrics show cumulative count of Article Views (full-text article views including HTML views, PDF and ePub downloads, according to the available data) and Abstracts Views on Vision4Press platform.
Data correspond to usage on the plateform after 2015. The current usage metrics is available 48-96 hours after online publication and is updated daily on week days.
Initial download of the metrics may take a while.