Fig. 10
Download original image
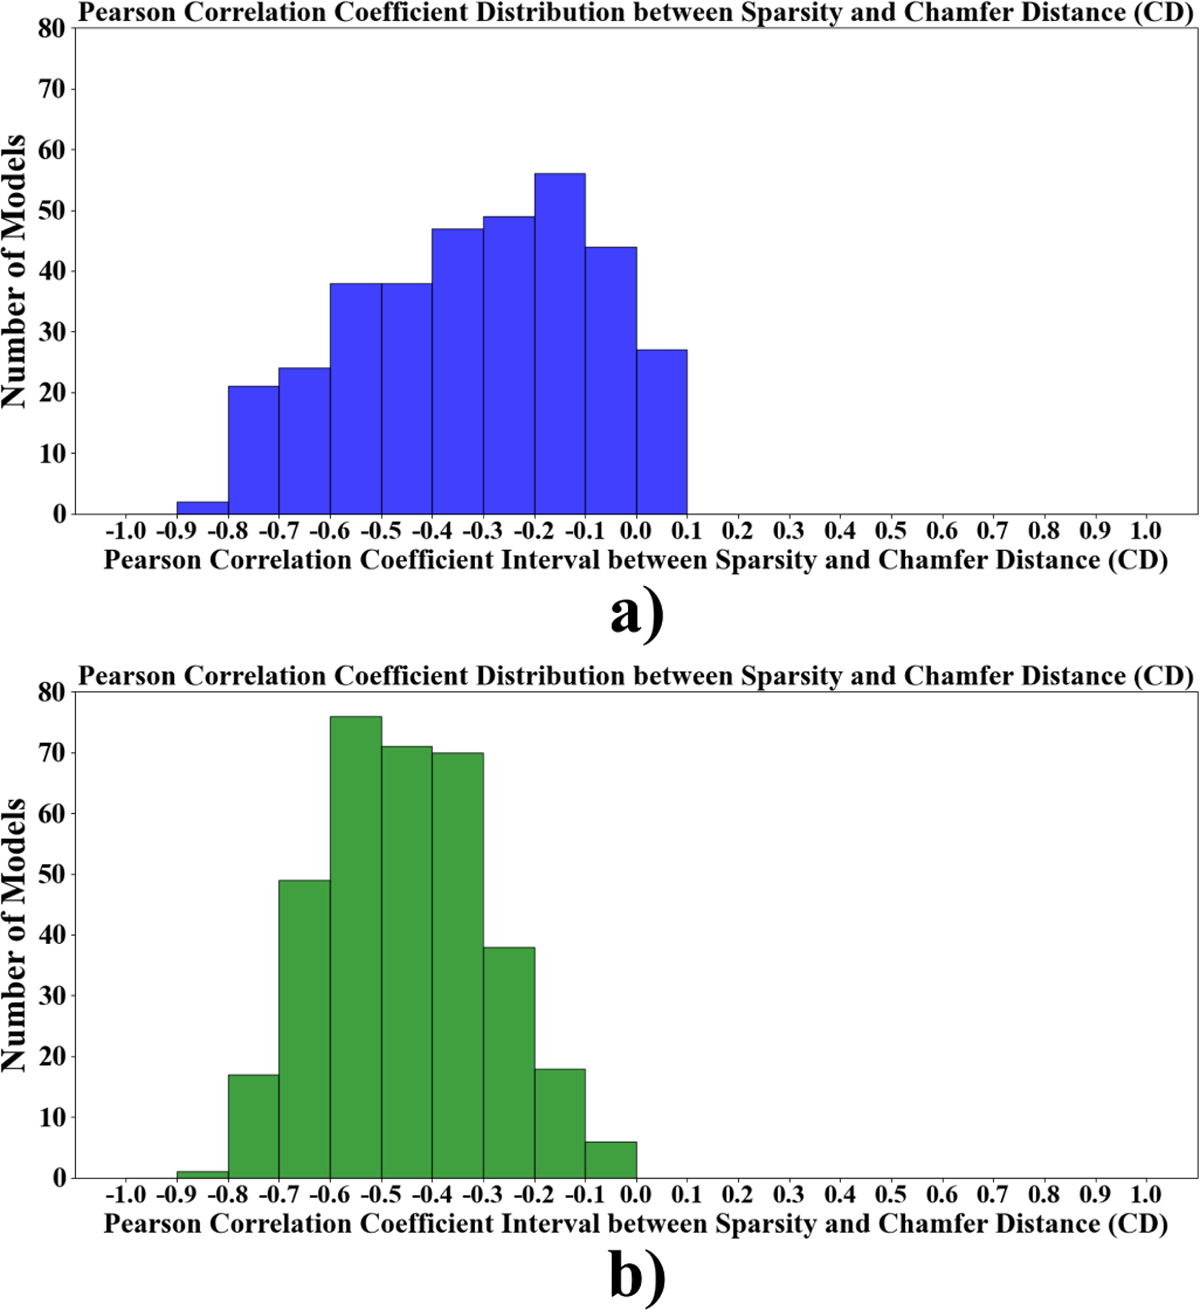
Distribution of the Pearson correlation coefficient between sparsity and CD. Panel a shows the distribution of the Pearson correlation coefficient between sparsity and CD calculated using the sphere-based grid partitioning method for sparsity. Panel b shows the distribution of the Pearson correlation coefficient between sparsity and CD calculated using the model-based grid partitioning method for sparsity.
Current usage metrics show cumulative count of Article Views (full-text article views including HTML views, PDF and ePub downloads, according to the available data) and Abstracts Views on Vision4Press platform.
Data correspond to usage on the plateform after 2015. The current usage metrics is available 48-96 hours after online publication and is updated daily on week days.
Initial download of the metrics may take a while.