Fig. 9
Download original image
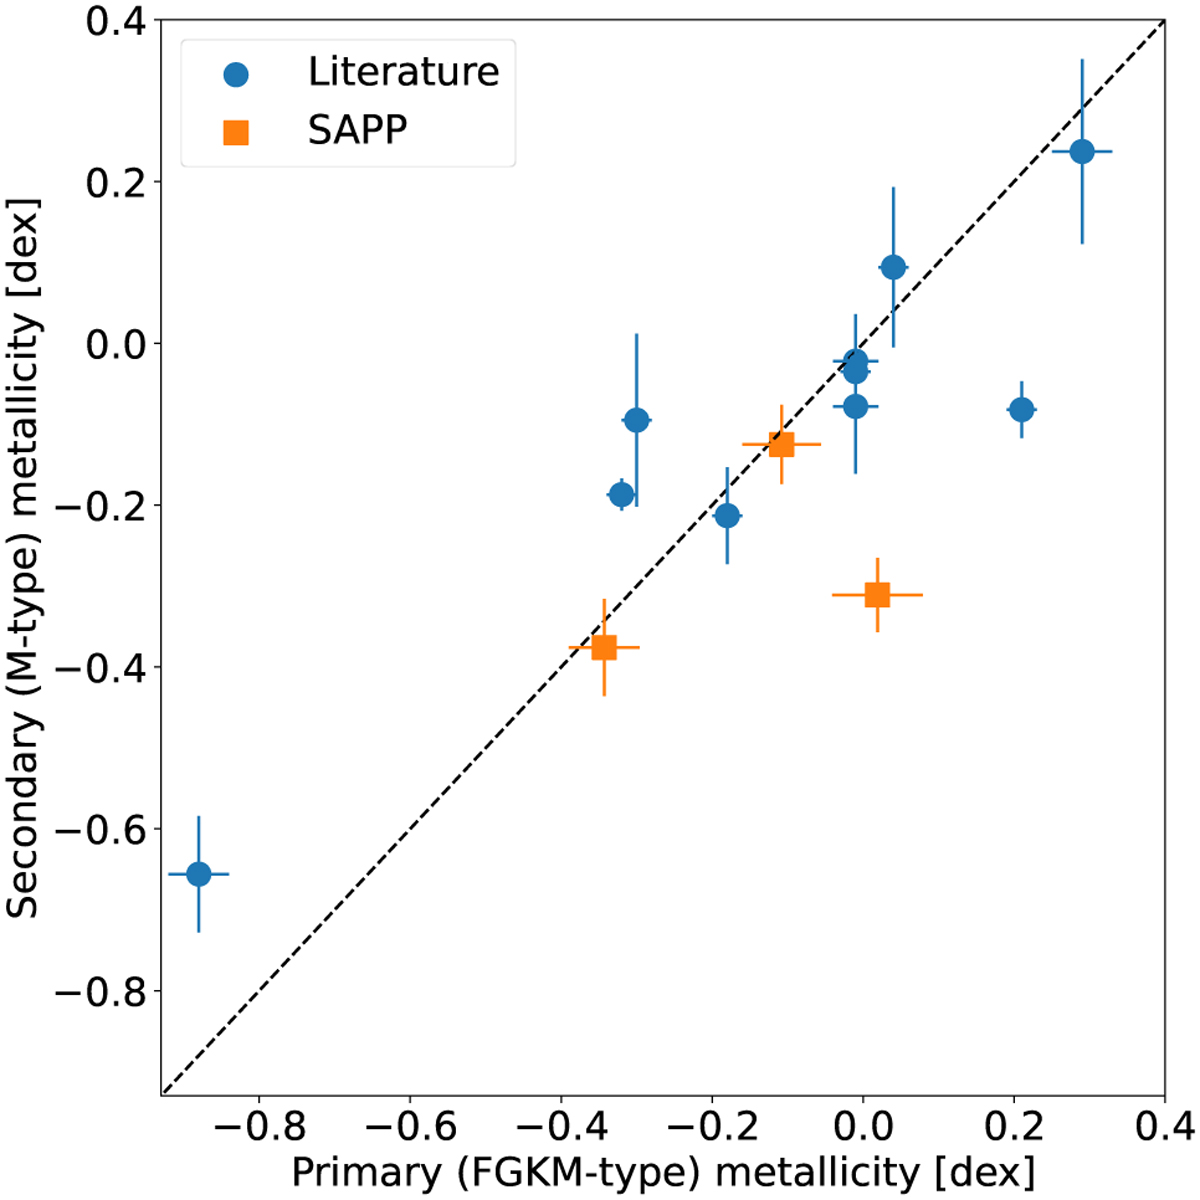
Comparing the derived [Fe/H] from the SAPP for M dwarf secondary components in a binary (y-axis, Table 2) with the metallicity of the primary (x-axis, Table 4). The blue circles show binaries with an FGK-type primary and an M dwarf secondary. The orange squares show binaries with a KM-type primary and an M dwarf secondary. All stars in these three systems were analysed with the SAPP using APOGEE spectra. The black dashed line corresponds to the 1:1 ratio.
Current usage metrics show cumulative count of Article Views (full-text article views including HTML views, PDF and ePub downloads, according to the available data) and Abstracts Views on Vision4Press platform.
Data correspond to usage on the plateform after 2015. The current usage metrics is available 48-96 hours after online publication and is updated daily on week days.
Initial download of the metrics may take a while.