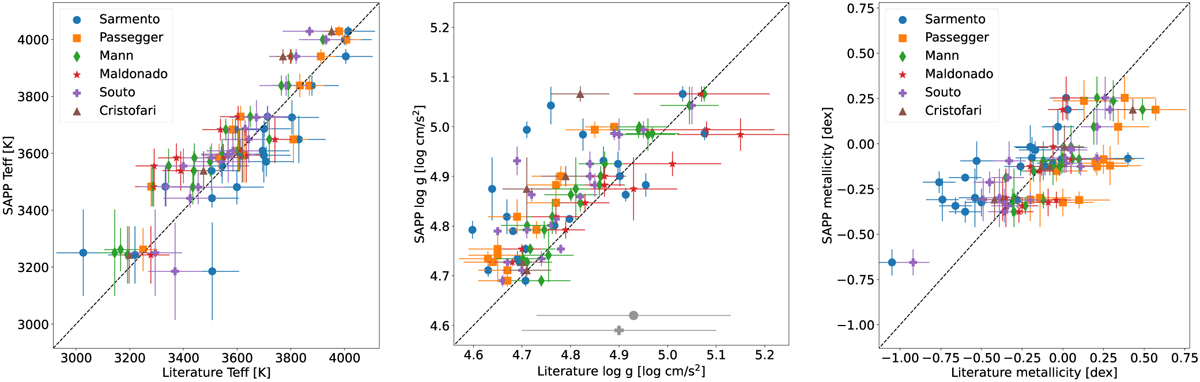
Fig. 7
Download original image
SAPP results compared with spectroscopic results from Sarmento et al. (2021); Passegger et al. (2019); Mann et al. (2015); Maldonado et al. (2020); Souto et al. (2022); Cristofari et al. (2022a). Values derived using the SAPP are shown on the vertical axis, and the literature values are shown on the horizontal axis. Left: effective temperature. Middle: surface gravity. The uncertainties for Sarmento et al. (2021) and Souto et al. (2022) are represented at the bottom of the figure in grey. One star is located outside of the borders of the figure: LSPM J1204+1728S for which the SAPP value is 4.86 dex and Sarmento et al. (2021) obtained 5.31 dex. Right: metallicity. The black dashed line in all panels corresponds to the 1:1 ratio.
Current usage metrics show cumulative count of Article Views (full-text article views including HTML views, PDF and ePub downloads, according to the available data) and Abstracts Views on Vision4Press platform.
Data correspond to usage on the plateform after 2015. The current usage metrics is available 48-96 hours after online publication and is updated daily on week days.
Initial download of the metrics may take a while.