Fig. 4
Download original image
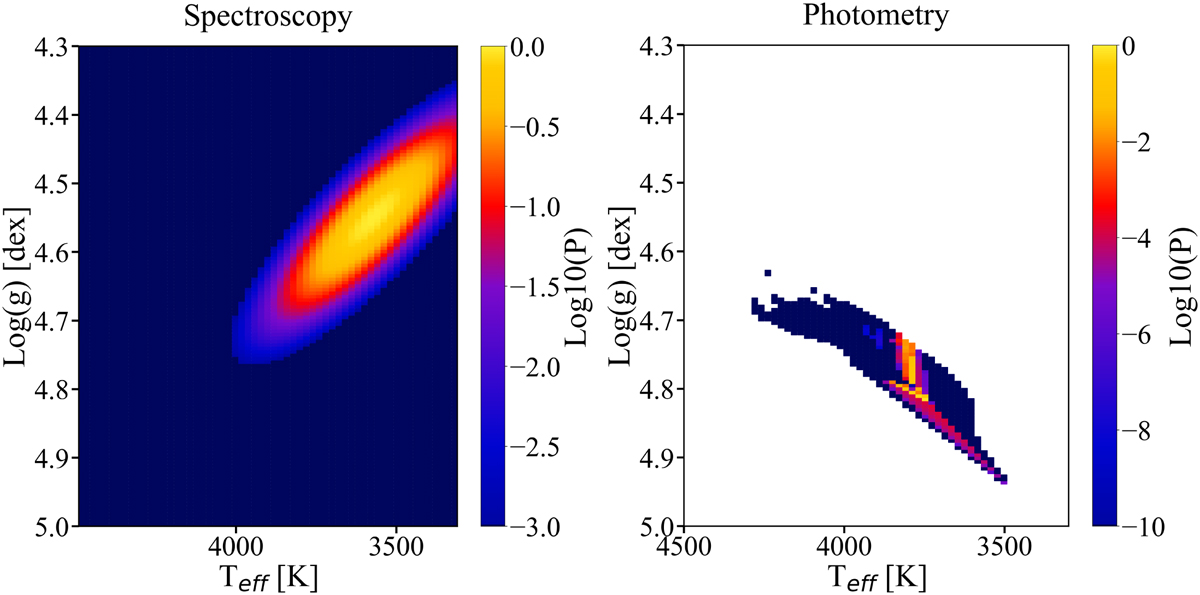
PDFs calculated for GJ 880 for two different SAPP modules: spectroscopy (left) and photometry (right). The horizontal axis is effective temperature, the vertical axis is surface gravity, and the colour scale is the logarithm of probability. Each PDF is sliced in the [Fe/H] dimension at their maximum probability. White space corresponds to NaN values.
Current usage metrics show cumulative count of Article Views (full-text article views including HTML views, PDF and ePub downloads, according to the available data) and Abstracts Views on Vision4Press platform.
Data correspond to usage on the plateform after 2015. The current usage metrics is available 48-96 hours after online publication and is updated daily on week days.
Initial download of the metrics may take a while.