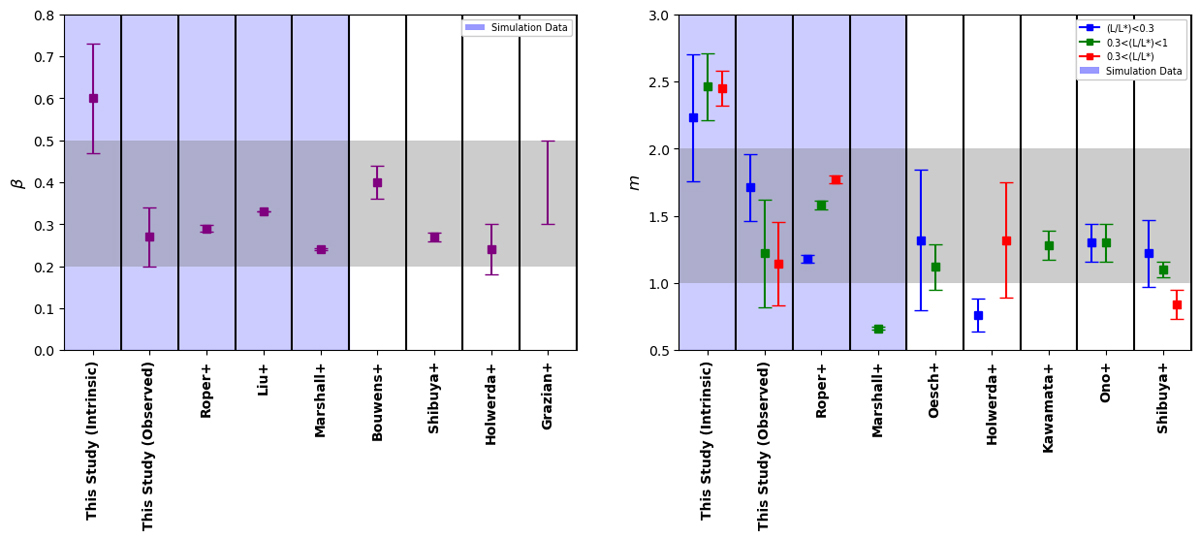
Fig. 9.
Download original image
Left: Comparison of the size-luminosity slopes (β) in relation with other studies (Roper et al. 2022; Liu et al. 2017; Marshall et al. 2022; Bouwens et al. 2022; Shibuya et al. 2015; Holwerda et al. 2015; Grazian et al. 2012) at z = 7 (blue shaded region are simulation studies) is shown. Right: Comparison of the UV size evolution slopes (m) in relation with other studies (Roper et al. 2022; Marshall et al. 2022; Oesch et al. 2010; Holwerda et al. 2015; Kawamata et al. 2018; Ono et al. 2013; Shibuya et al. 2015) is shown.
Current usage metrics show cumulative count of Article Views (full-text article views including HTML views, PDF and ePub downloads, according to the available data) and Abstracts Views on Vision4Press platform.
Data correspond to usage on the plateform after 2015. The current usage metrics is available 48-96 hours after online publication and is updated daily on week days.
Initial download of the metrics may take a while.