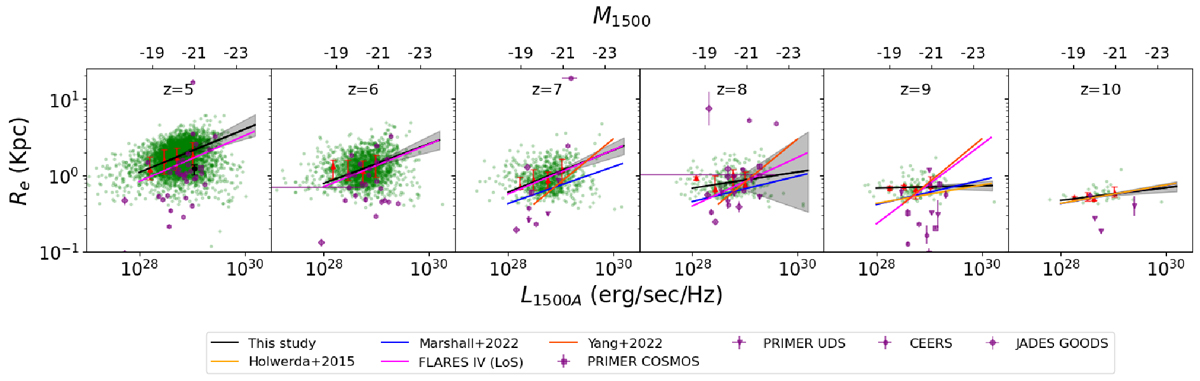
Fig. 8.
Download original image
UV luminosity size relation at different redshifts is shown. The y-axis shows the UV 1500 Å sizes in kpc and the x-axis shows luminosity at the same wavelength. The green scatter shows our sample of galaxies analysed with radiative transfer and then simulated observations for NIRCAM. The red plots show the median luminosity and sizes in bins of 0.3 dex in luminosity with 16th and 84th percentile error bars. The black line is an linear fit to the median luminosity and sizes fit to the power law. We also compare our sample with observational studies (Holwerda et al. 2015; Bouwens et al. 2022) and simulations (Marshall et al. 2022, FLARES IV). JWST data have been taken from Morishita et al. (2024) and Ormerod et al. (2024) for the sample with M∗/M⊙ ≥ 109 from the JADES (Eisenstein et al. 2023), CEERS (Holwerda et al. 2024), and PRIMER survey.
Current usage metrics show cumulative count of Article Views (full-text article views including HTML views, PDF and ePub downloads, according to the available data) and Abstracts Views on Vision4Press platform.
Data correspond to usage on the plateform after 2015. The current usage metrics is available 48-96 hours after online publication and is updated daily on week days.
Initial download of the metrics may take a while.