Open Access
Fig. J.1.
Download original image
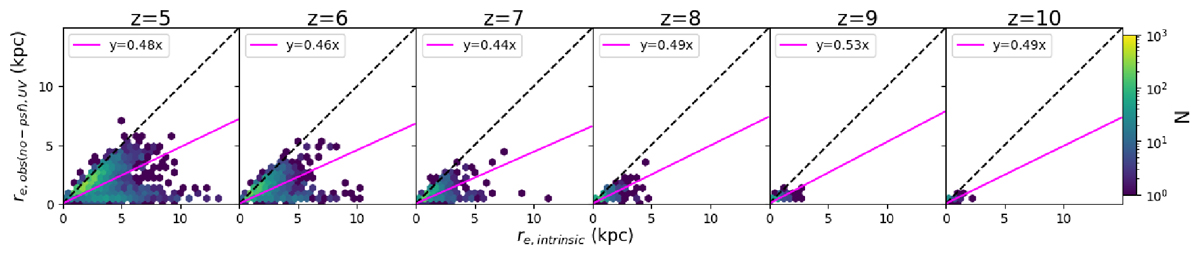
Observed UV sizes with no PSF effect from mock images (y-axis) are plotted as a function of intrinsic sizes (x-axis) at S/N=15. The black dashed line is a 1:1 relation whereas the magenta line is the best fit y=mx relation where y is mock image effective radius and x is simulation effective radius
Current usage metrics show cumulative count of Article Views (full-text article views including HTML views, PDF and ePub downloads, according to the available data) and Abstracts Views on Vision4Press platform.
Data correspond to usage on the plateform after 2015. The current usage metrics is available 48-96 hours after online publication and is updated daily on week days.
Initial download of the metrics may take a while.