Fig. F.1.
Download original image
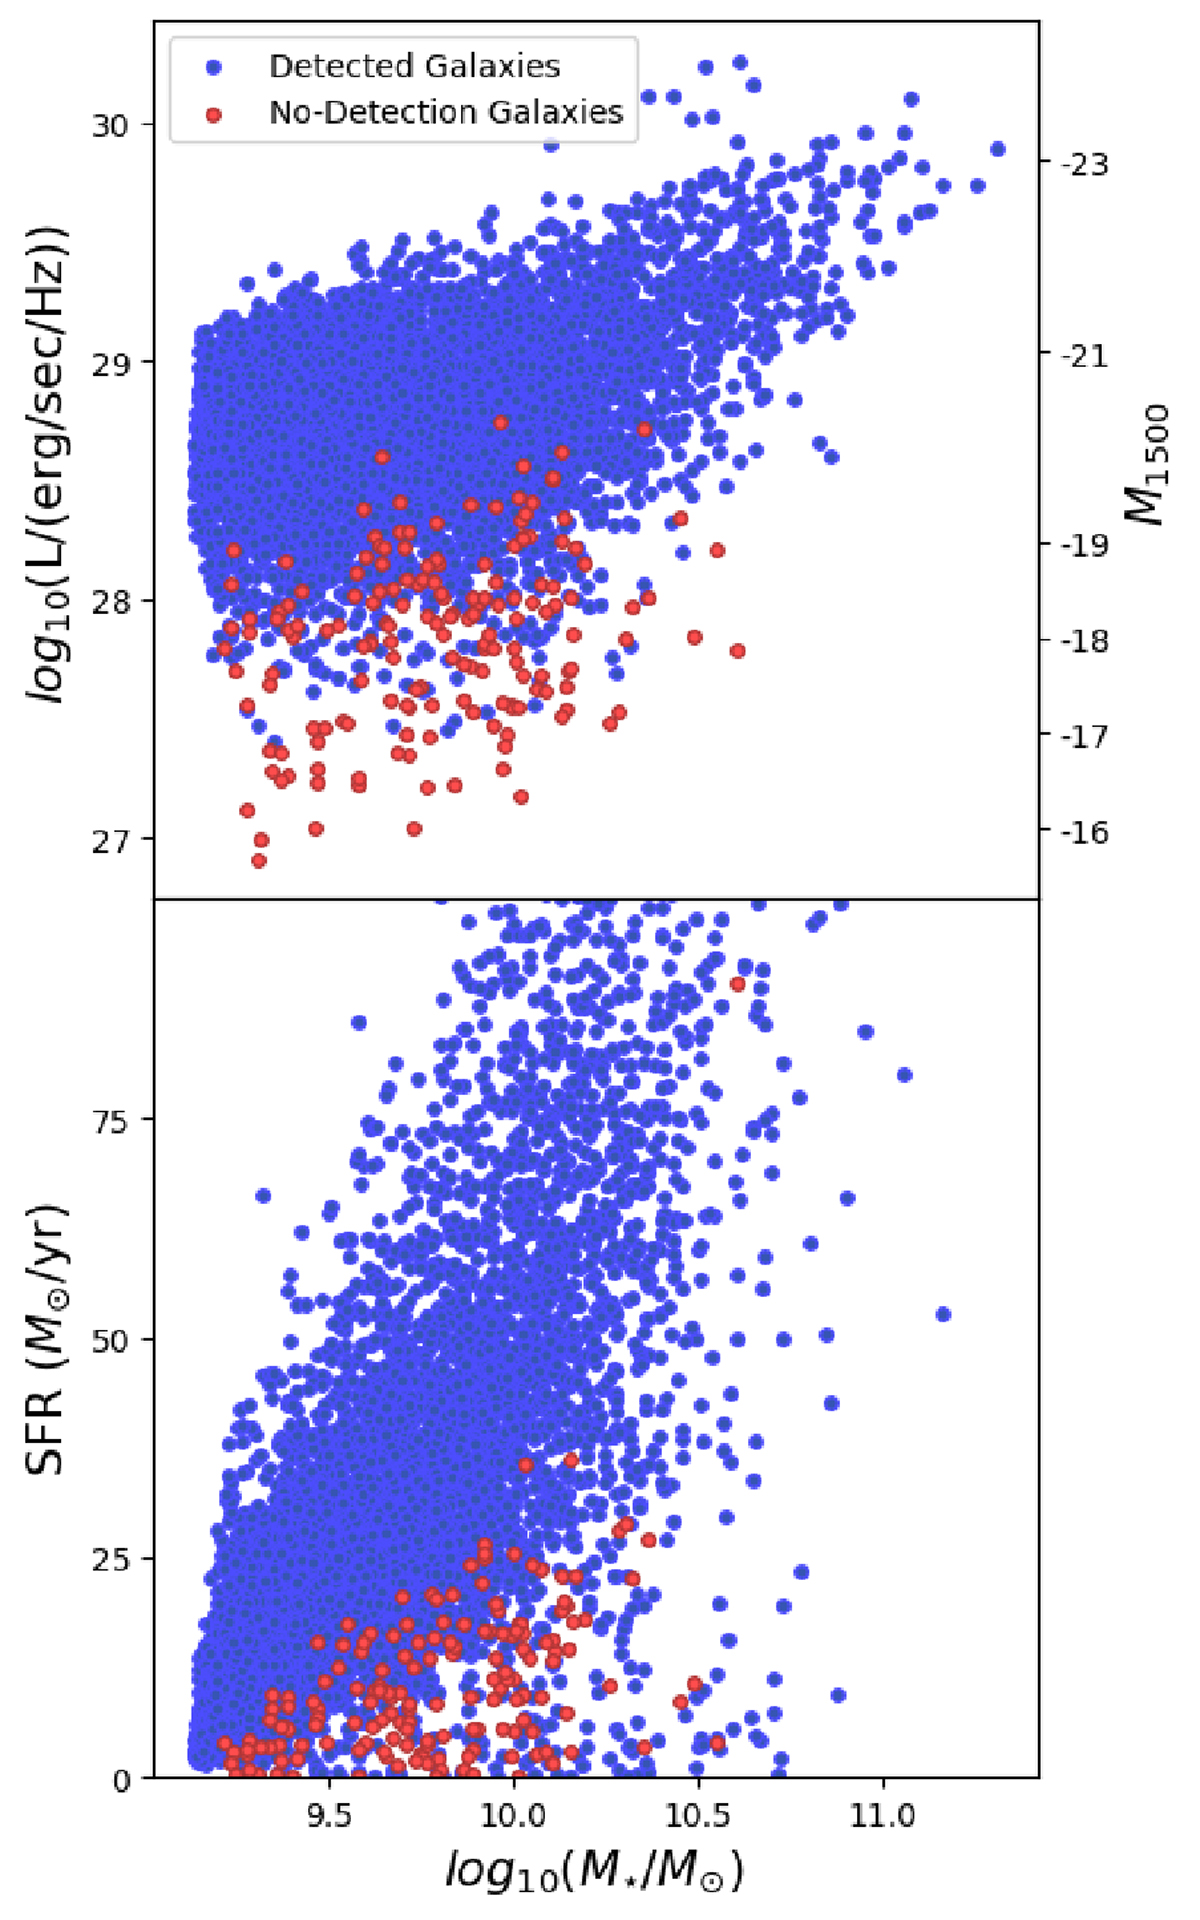
Upper panel: FUV luminosities (y-axis) are plotted against their respective Stellar Masses (x-axis). Detected galaxies are shown in blue and non-detections in red, at S/N=5. The scatter is of the whole sample across all redshifts with most non-detections lying at z=5,6. Lower Panel: Similar figure as the upper panel, we now compare SFR (y-axis) of the galaxies detected using mock images and the ones which were not at different stellar masses (x-axis) at S/N=5. Detected galaxies are shown in blue and non-detections in red.
Current usage metrics show cumulative count of Article Views (full-text article views including HTML views, PDF and ePub downloads, according to the available data) and Abstracts Views on Vision4Press platform.
Data correspond to usage on the plateform after 2015. The current usage metrics is available 48-96 hours after online publication and is updated daily on week days.
Initial download of the metrics may take a while.