Open Access
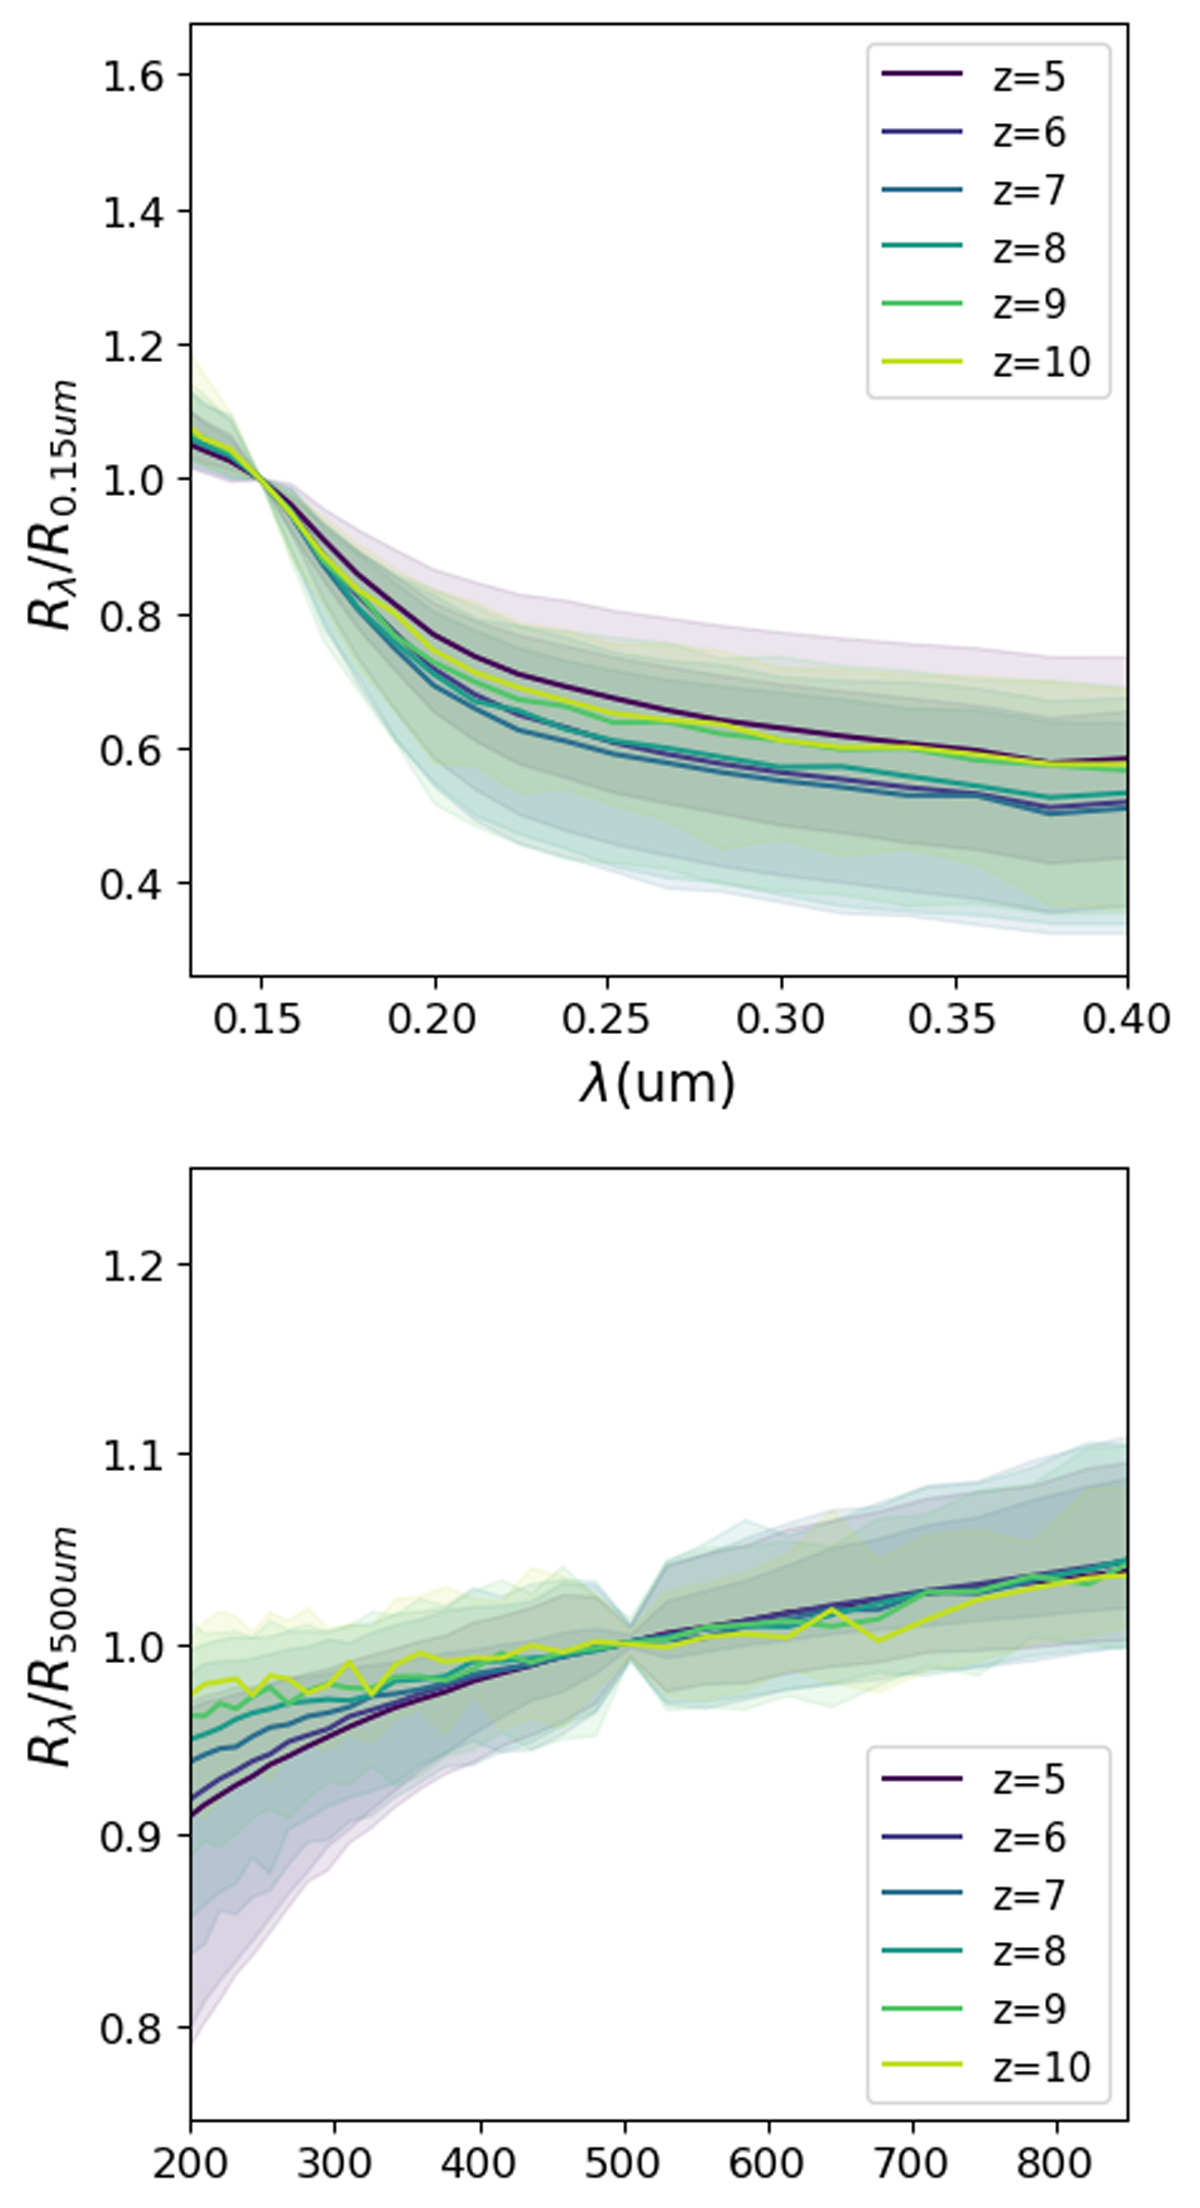
Fig. 15.
Download original image
Evolution of normalised size with rest-frame wavelength is shown in UV (upper panel) and IR (lower panel). The solid curves correspond to the median of the distribution, whereas the colour-shaded regions mark the one-sigma scatter of the distribution
Current usage metrics show cumulative count of Article Views (full-text article views including HTML views, PDF and ePub downloads, according to the available data) and Abstracts Views on Vision4Press platform.
Data correspond to usage on the plateform after 2015. The current usage metrics is available 48-96 hours after online publication and is updated daily on week days.
Initial download of the metrics may take a while.