Open Access
Fig. 12.
Download original image
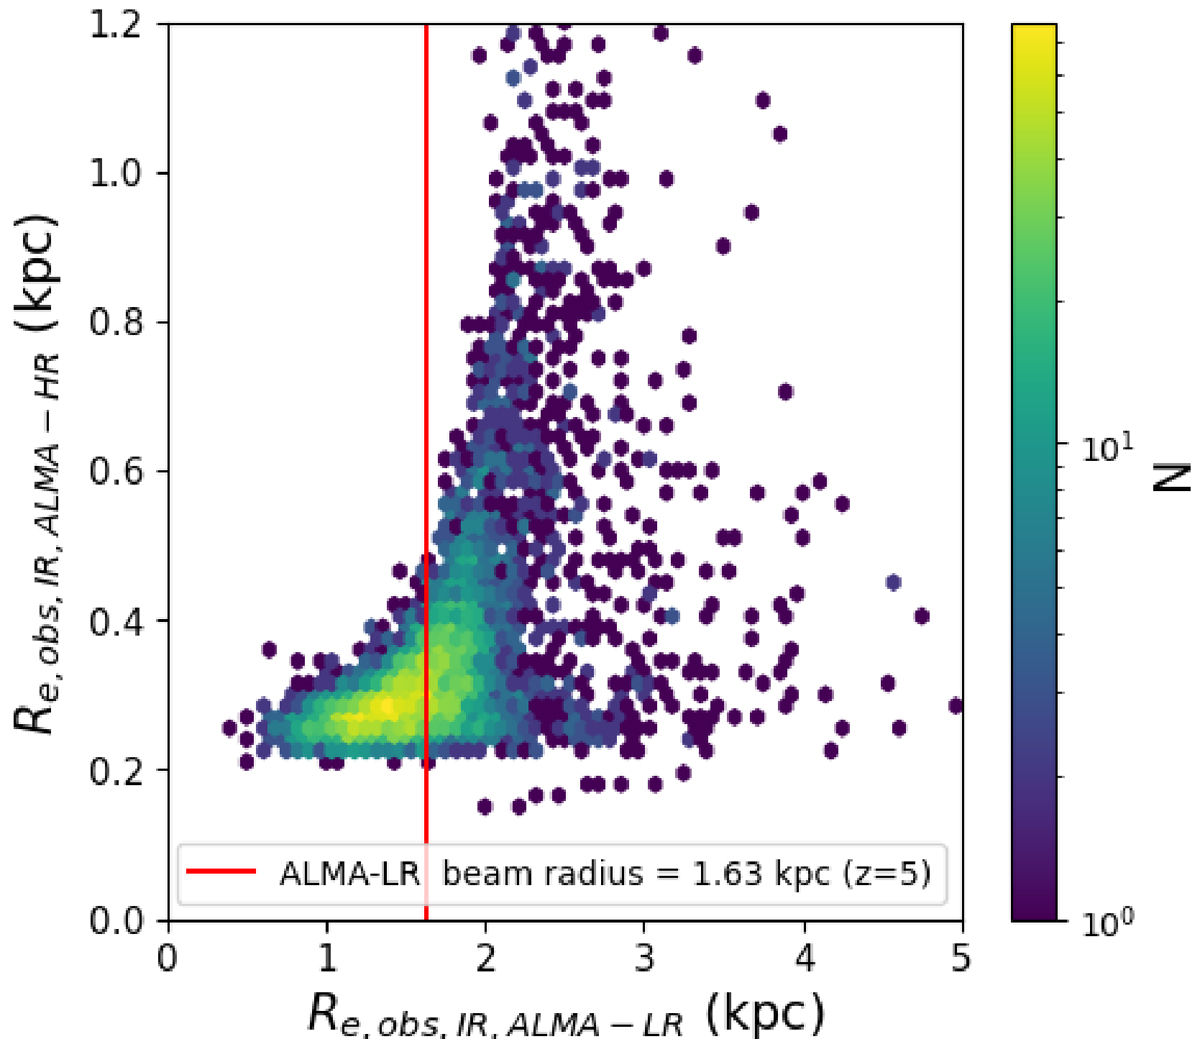
Comparison of 158 μm sizes between low (≈0.3′′) and high (≈0.01′′) resolution ALMA configuration set-up is shown above for z = 5, 6 sample. The high resolution (≈0.01′′) sizes is on y-axis with low resolution (≈0.3′′) sizes on x-axis. The line shows the average beam radius for the low-resolution observations.
Current usage metrics show cumulative count of Article Views (full-text article views including HTML views, PDF and ePub downloads, according to the available data) and Abstracts Views on Vision4Press platform.
Data correspond to usage on the plateform after 2015. The current usage metrics is available 48-96 hours after online publication and is updated daily on week days.
Initial download of the metrics may take a while.