Fig. 10.
Download original image
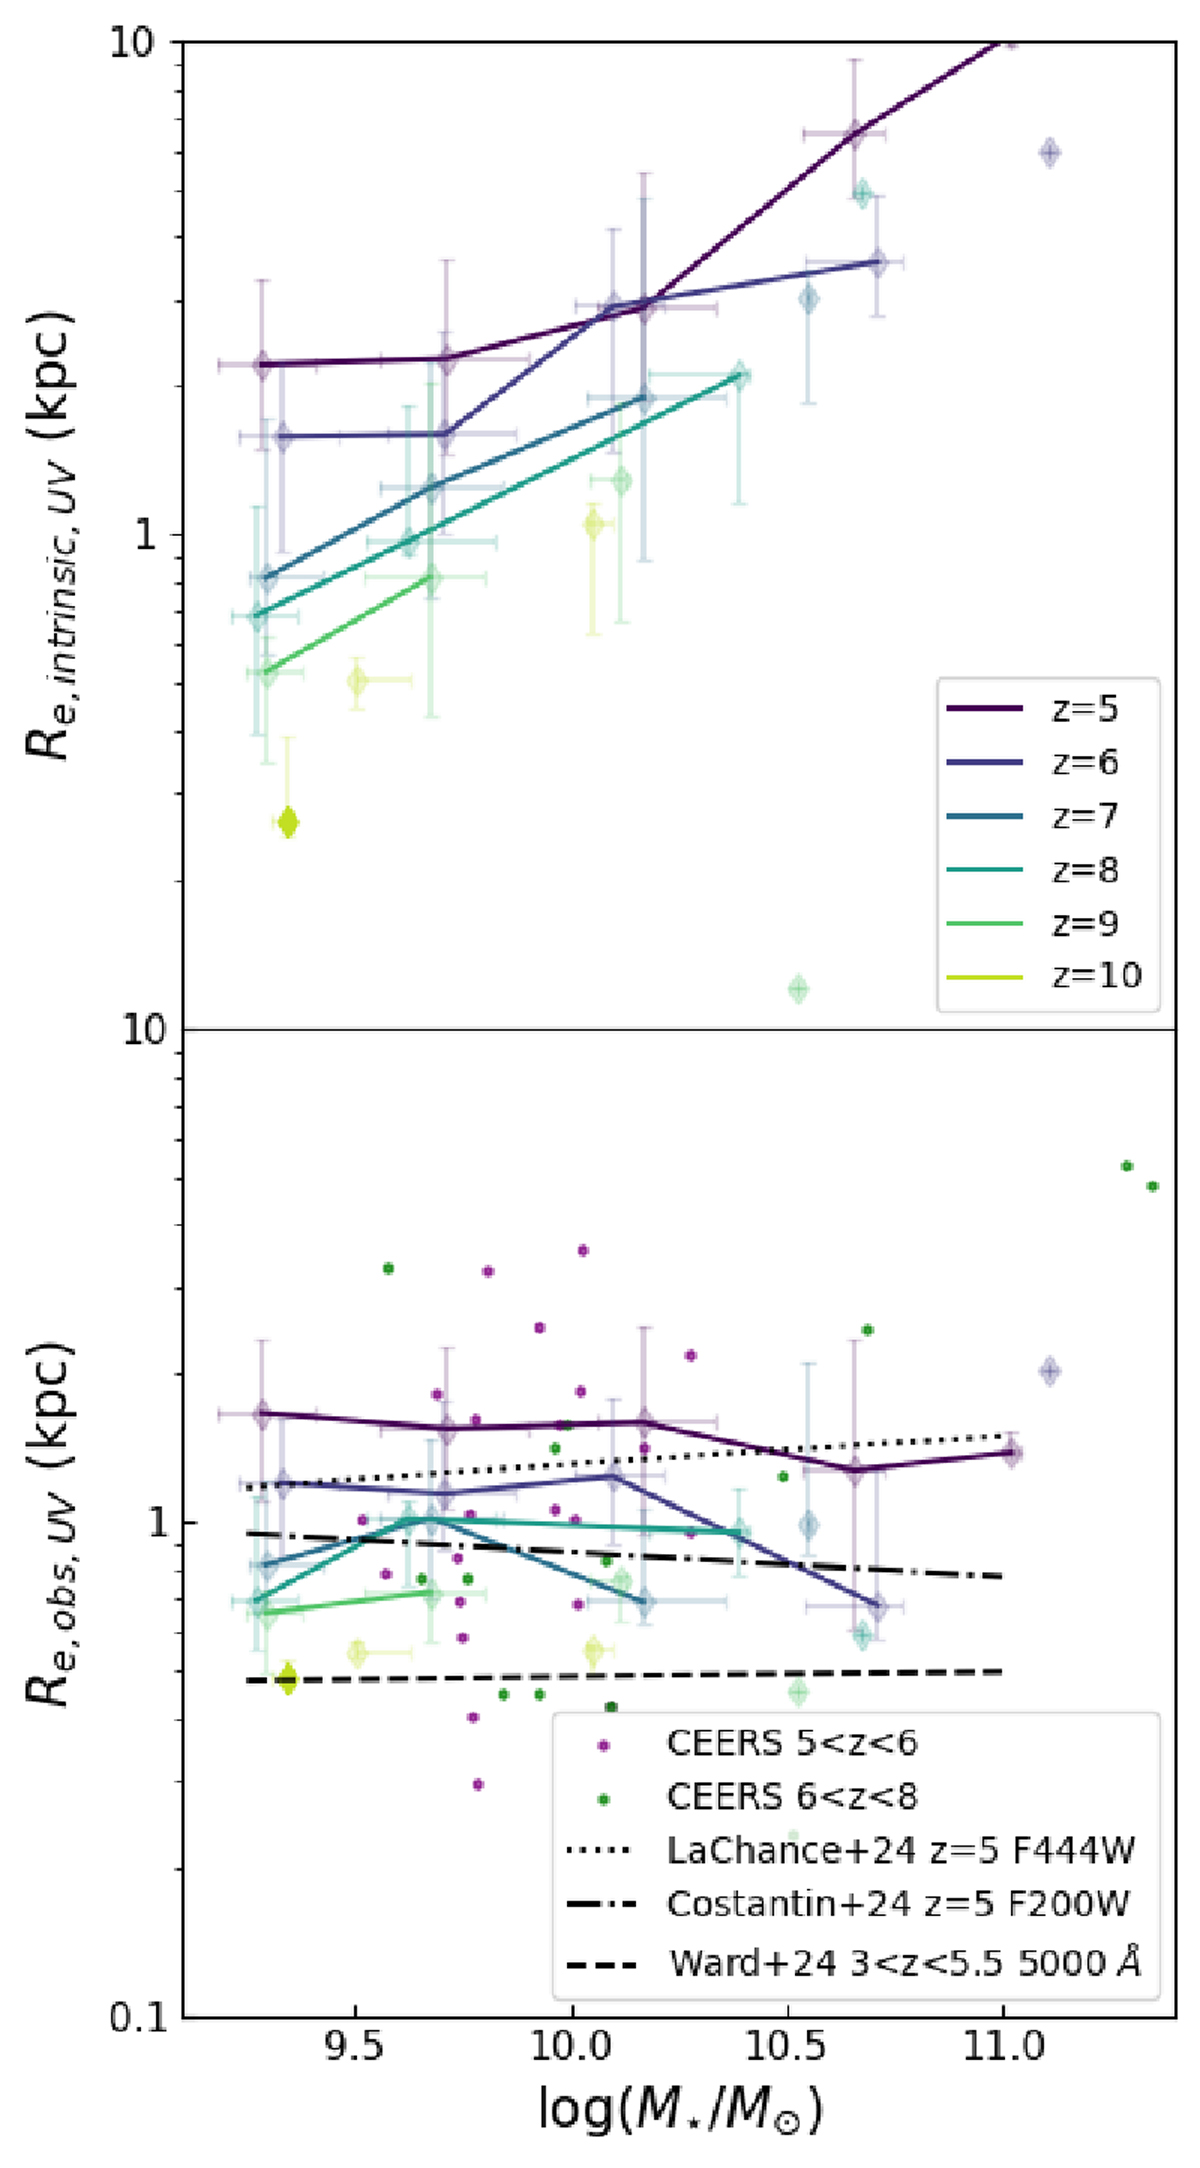
Upper panel: Evolution of the UV simulation sizes (y-axis, in kpc) as function of stellar mass (x-axis) for z ∈ [5, 10]. Lower panel: Evolution of sizes from mock observations as function of stellar mass. Size mass relation for simulated observations from Costantin et al. (2023) and LaChance et al. (2024) and NIRCAM observations from Ward et al. (2024). CEERS data has been taken from Morishita et al. (2024) and Ormerod et al. (2024).
Current usage metrics show cumulative count of Article Views (full-text article views including HTML views, PDF and ePub downloads, according to the available data) and Abstracts Views on Vision4Press platform.
Data correspond to usage on the plateform after 2015. The current usage metrics is available 48-96 hours after online publication and is updated daily on week days.
Initial download of the metrics may take a while.