Fig. 5
Download original image
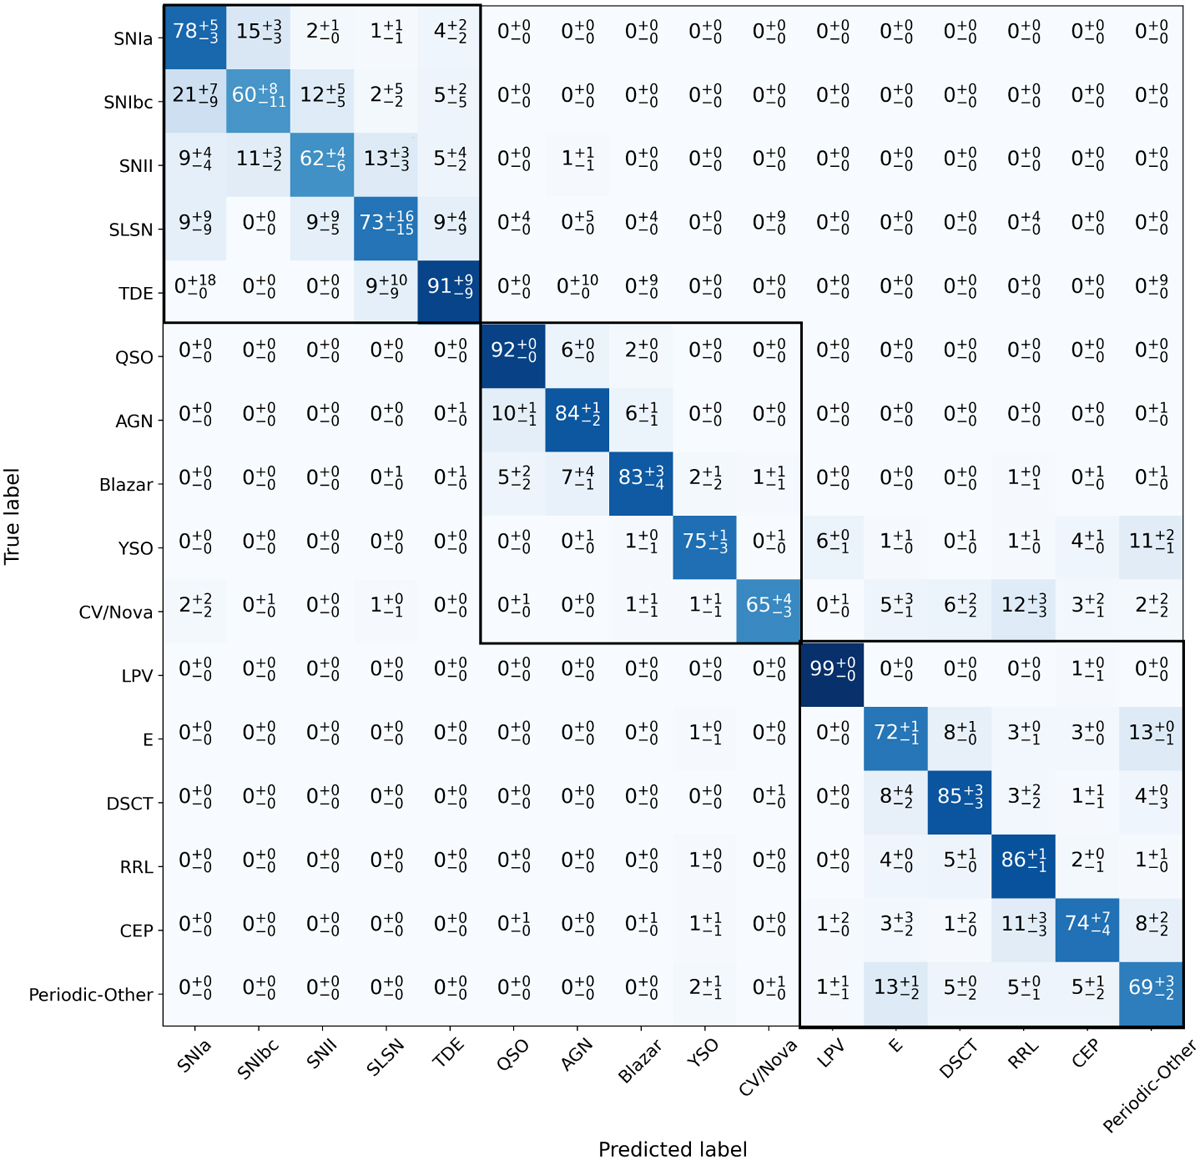
Recall confusion matrix of the bottom-level classifier. It was generated using 20 randomly generated training and testing sets. It showcases the median, 5 and 95 percentile errors for all subclasses. The black squares enclose the confusion matrices for the three distinct bottom-level classifiers. Higher confusion can be seen within the subclasses of the same hierarchic group.
Current usage metrics show cumulative count of Article Views (full-text article views including HTML views, PDF and ePub downloads, according to the available data) and Abstracts Views on Vision4Press platform.
Data correspond to usage on the plateform after 2015. The current usage metrics is available 48-96 hours after online publication and is updated daily on week days.
Initial download of the metrics may take a while.