Fig. 4
Download original image
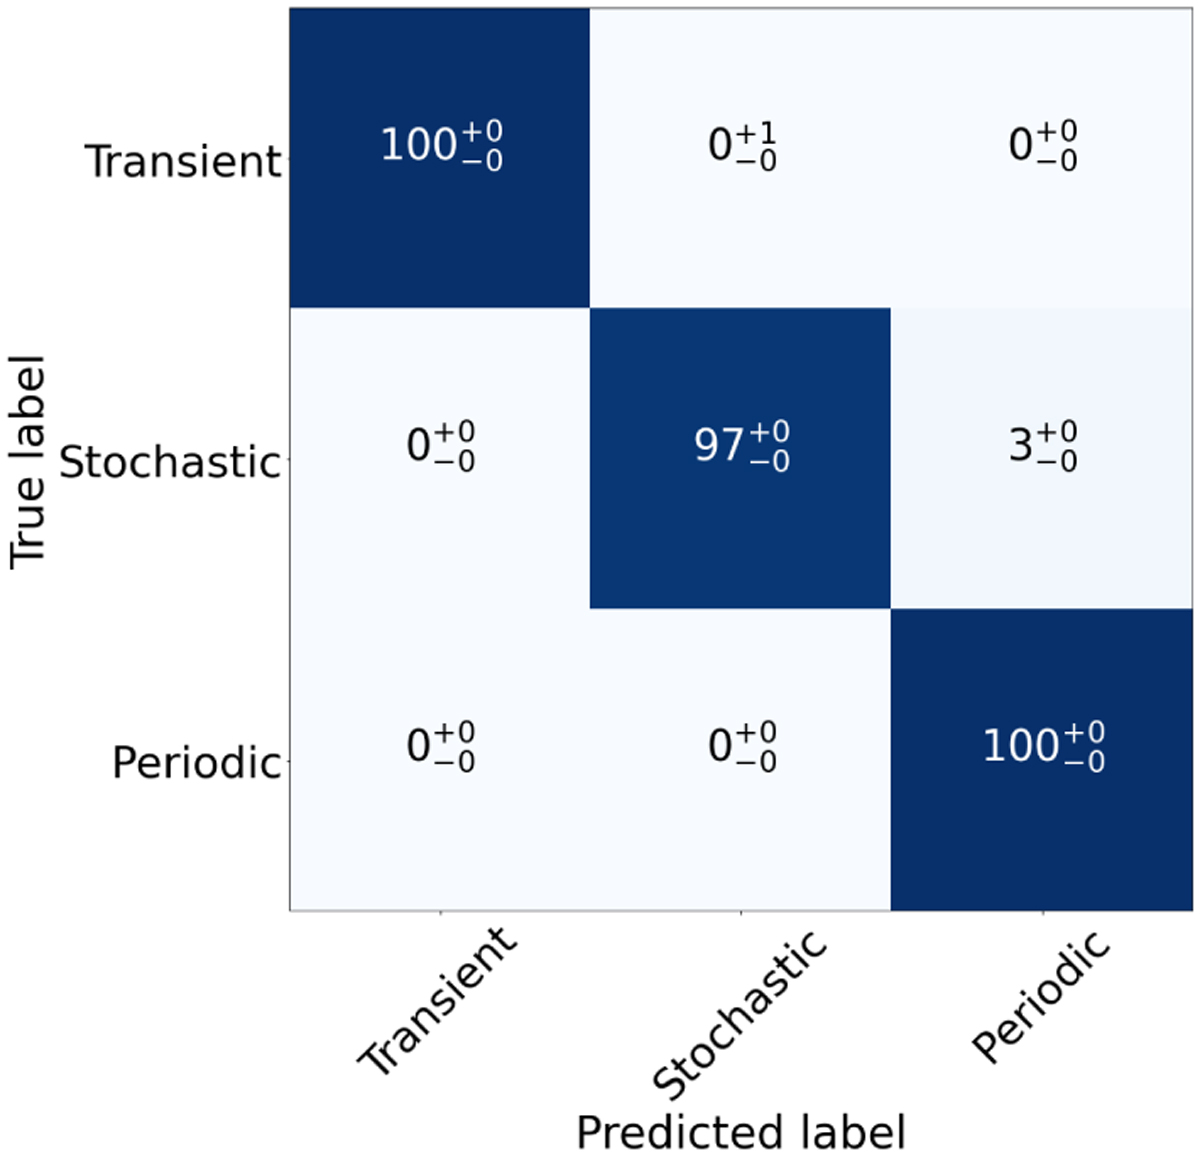
Recall confusion matrix of the top level generated using 20 randomly generated training and testing sets. After predicting the 20 testing sets, a median, and the 5 and 95 percentiles are provided for each class. This matrix is normalized by dividing each row by the total number of objects per class with known labels. We round these percentages to whole numbers. This indicates a high level of accuracy with a low percentage of incorrectly classified sources.
Current usage metrics show cumulative count of Article Views (full-text article views including HTML views, PDF and ePub downloads, according to the available data) and Abstracts Views on Vision4Press platform.
Data correspond to usage on the plateform after 2015. The current usage metrics is available 48-96 hours after online publication and is updated daily on week days.
Initial download of the metrics may take a while.