Fig. 3
Download original image
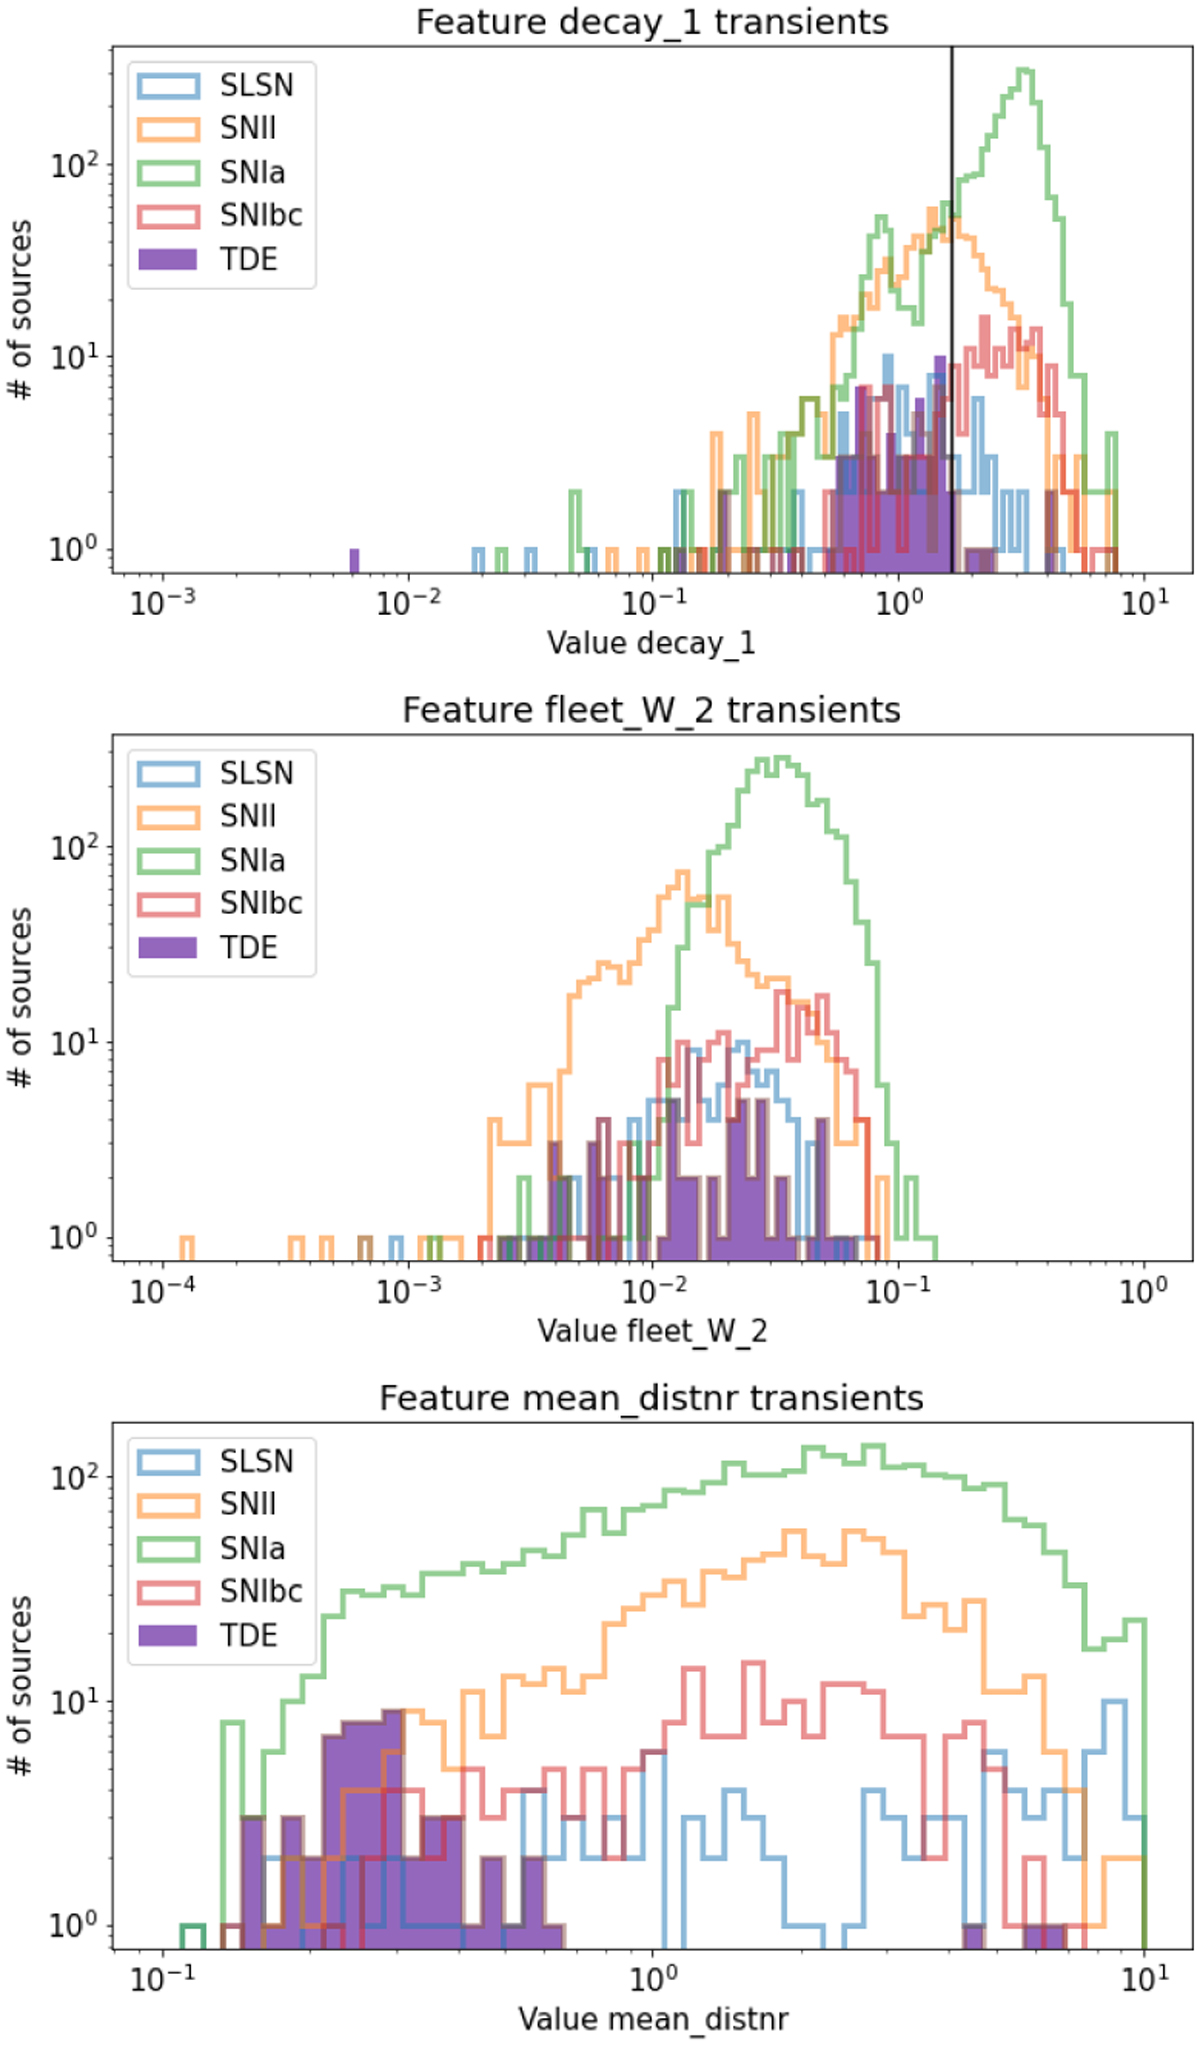
Histograms of the following features for classes in the transient branch in log. The top represents the calculated decays for the g band of all the transients in the labeled set, a black line is plotted to represent the 5/3 usual decay for the TDEs. The middle represents the r band set of data for the W parameter of the FLEET parametric model. The bottom represents the values taken by mean_distnr, showcasing the different distribution of the TDEs compared to the rest of the transients of the labeled set.
Current usage metrics show cumulative count of Article Views (full-text article views including HTML views, PDF and ePub downloads, according to the available data) and Abstracts Views on Vision4Press platform.
Data correspond to usage on the plateform after 2015. The current usage metrics is available 48-96 hours after online publication and is updated daily on week days.
Initial download of the metrics may take a while.