Fig. 18
Download original image
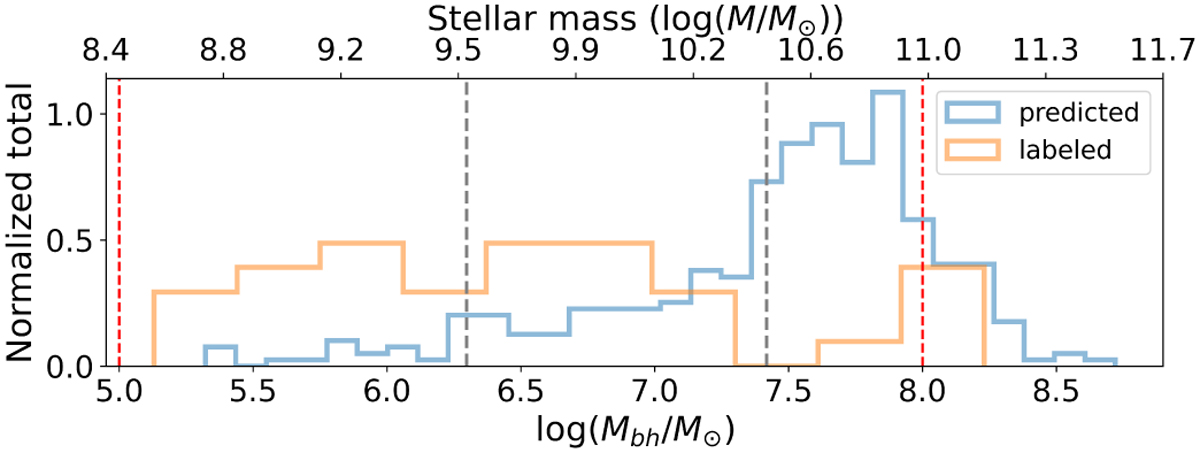
Histogram of the host black hole (BH) masses (bottom x-axis) and stellar masses (top x-axis) of 350 predicted sources and 33 TDEs from the labeled set, each associated with a host galaxy. These masses were calculated using the stellar masses of the host galaxies (using the relation in Reines & Volonteri 2015), as provided by the MPA-JHU group and included in SDSS DR8 (Aihara et al. 2011). The red dashed lines indicate the theoretical mass range within which a TDE is expected to occur. The dashed gray lines mark the locations of ZTF18aaowtgn and ZTF22aajnyhg, which are among our 56 TDE candidates with a probability above 50%.
Current usage metrics show cumulative count of Article Views (full-text article views including HTML views, PDF and ePub downloads, according to the available data) and Abstracts Views on Vision4Press platform.
Data correspond to usage on the plateform after 2015. The current usage metrics is available 48-96 hours after online publication and is updated daily on week days.
Initial download of the metrics may take a while.