Fig. 13
Download original image
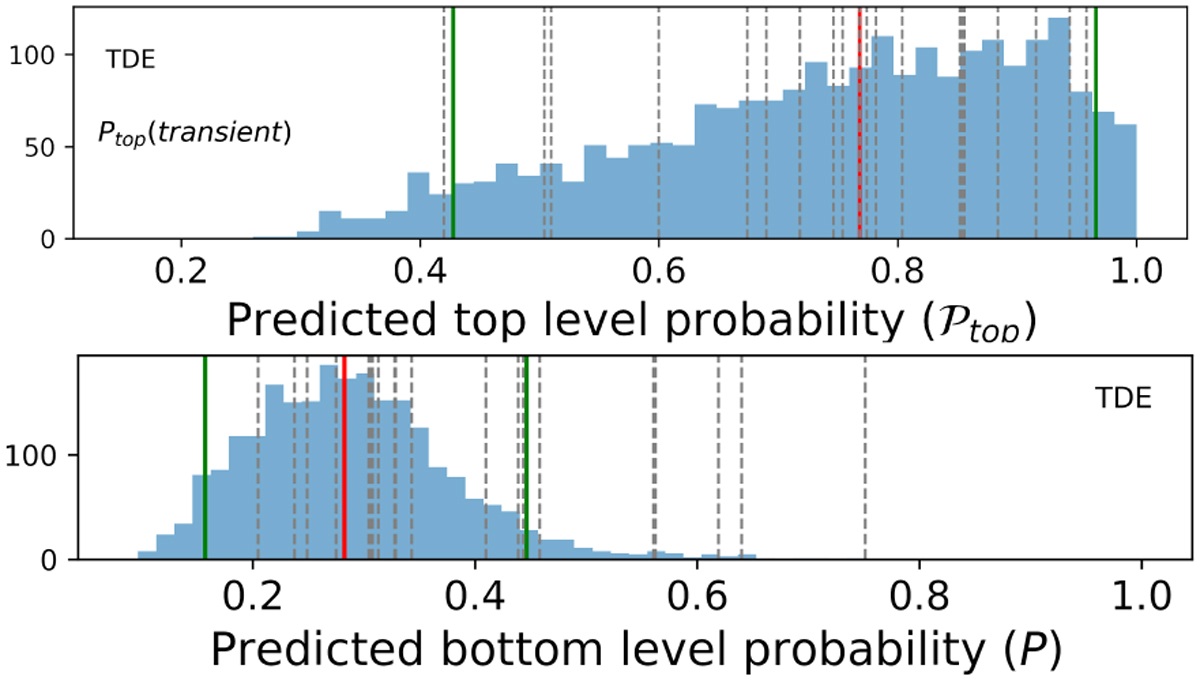
Histograms displaying normalized probability distributions for the top and bottom level probabilities for the TDE candidates of the unlabeled set. Red lines denote the median probability for each class, green lines show the 5 and 95 percentiles, and dashed gray lines show the predictions for a sample of spectroscopically confirmed TDEs.
Current usage metrics show cumulative count of Article Views (full-text article views including HTML views, PDF and ePub downloads, according to the available data) and Abstracts Views on Vision4Press platform.
Data correspond to usage on the plateform after 2015. The current usage metrics is available 48-96 hours after online publication and is updated daily on week days.
Initial download of the metrics may take a while.