Fig. 10
Download original image
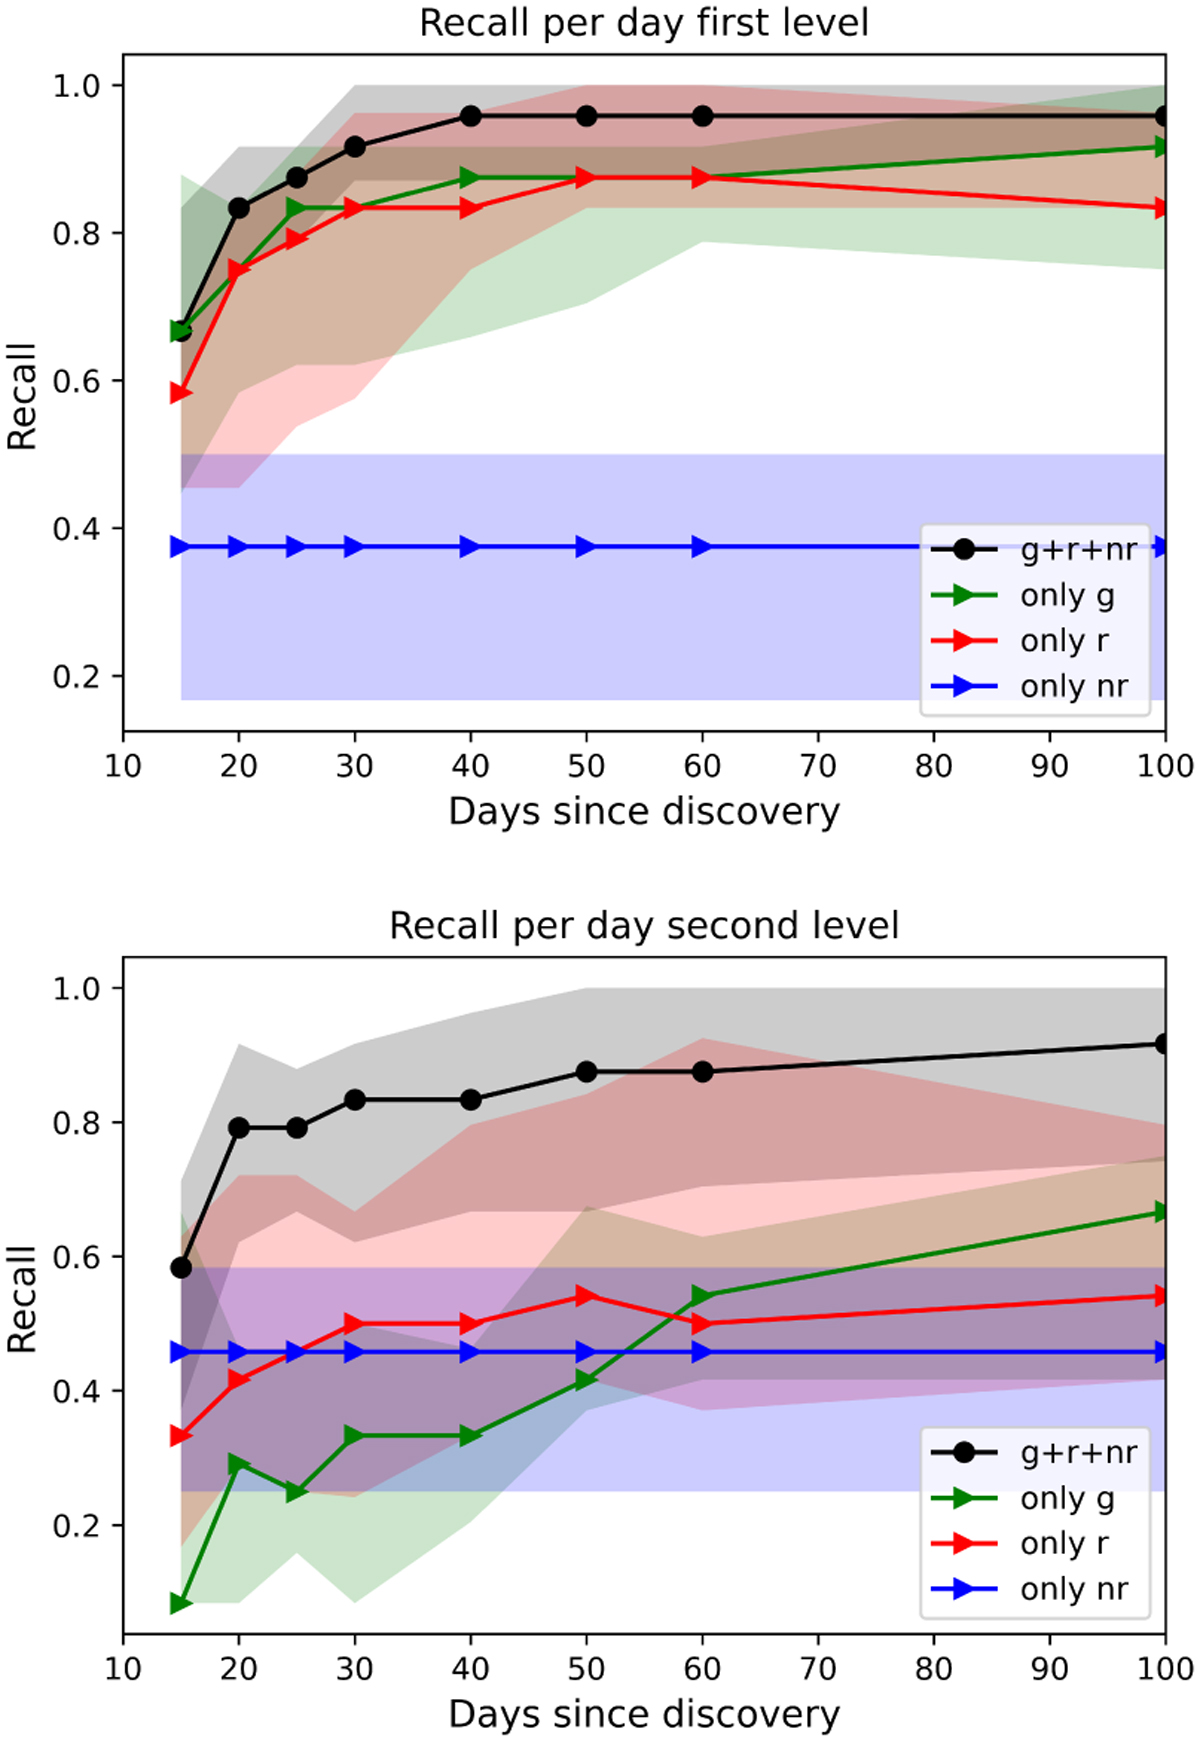
Recall per day for the TDE subclass on the first level (top) and the second level (bottom). The colored symbols, curves, and shaded regions indicate the median and 5–95 quantile ranges of recall, depending on whether the model was trained with all features (g + r + nr; black and gray), only g-band features (green), only r-band features (red), or only nr features (blue).
Current usage metrics show cumulative count of Article Views (full-text article views including HTML views, PDF and ePub downloads, according to the available data) and Abstracts Views on Vision4Press platform.
Data correspond to usage on the plateform after 2015. The current usage metrics is available 48-96 hours after online publication and is updated daily on week days.
Initial download of the metrics may take a while.