Fig. 13.
Download original image
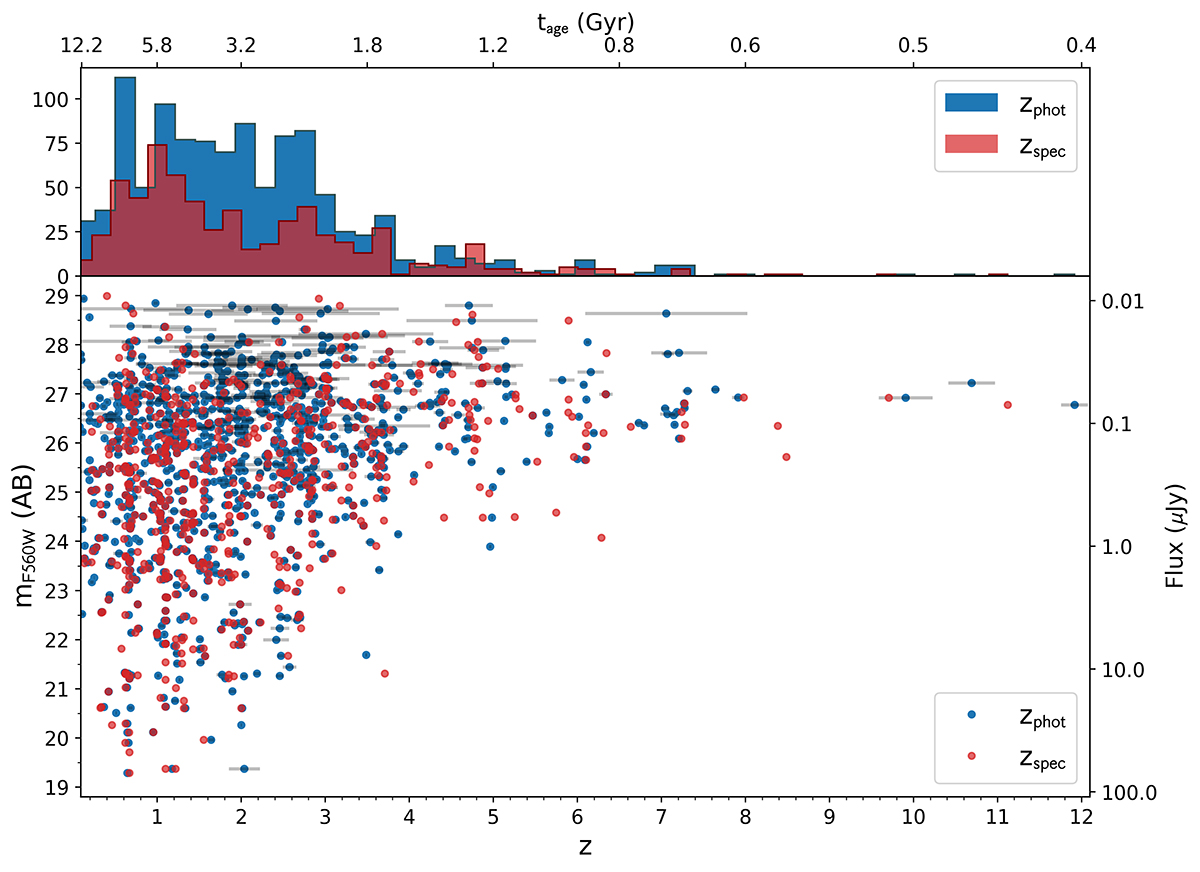
Top: Histogram showing spectroscopic (red) and photometric (blue) redshift distribution. Bottom: Spectroscopic (red) and photometric (blue) redshift vs F560W magnitude. The photometric redshifts are estimated with EAZY. Only sources detected at σ > 2 in F560W, and with a 1σ redshift uncertainty Δz < 1 were included (1069 sources).
Current usage metrics show cumulative count of Article Views (full-text article views including HTML views, PDF and ePub downloads, according to the available data) and Abstracts Views on Vision4Press platform.
Data correspond to usage on the plateform after 2015. The current usage metrics is available 48-96 hours after online publication and is updated daily on week days.
Initial download of the metrics may take a while.