Open Access
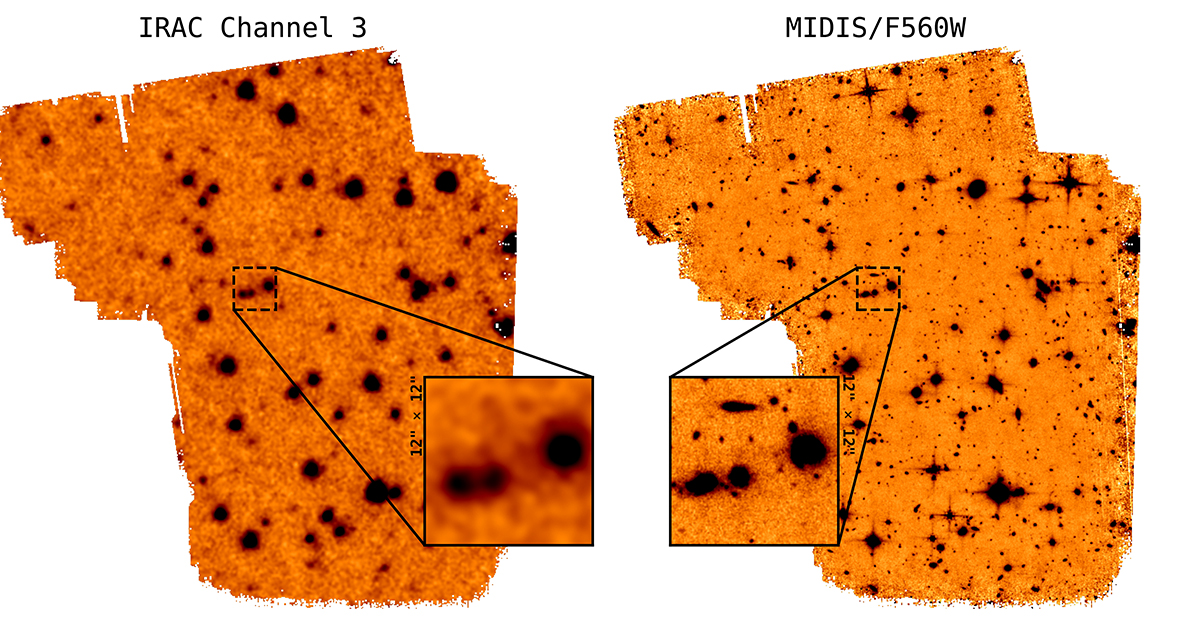
Fig. 11.
Download original image
Left: Spitzer/IRAC band 3 (λeff = 5.8 μm), based on exposure time of ∼40 h, cropped to the size of the MIDIS field. Right: our MIRI/F560W image. The insets show a zoom-in on a 12″ × 12″ region highlighting the improvement in sensitivity and resolution.
Current usage metrics show cumulative count of Article Views (full-text article views including HTML views, PDF and ePub downloads, according to the available data) and Abstracts Views on Vision4Press platform.
Data correspond to usage on the plateform after 2015. The current usage metrics is available 48-96 hours after online publication and is updated daily on week days.
Initial download of the metrics may take a while.