Fig. 7.
Download original image
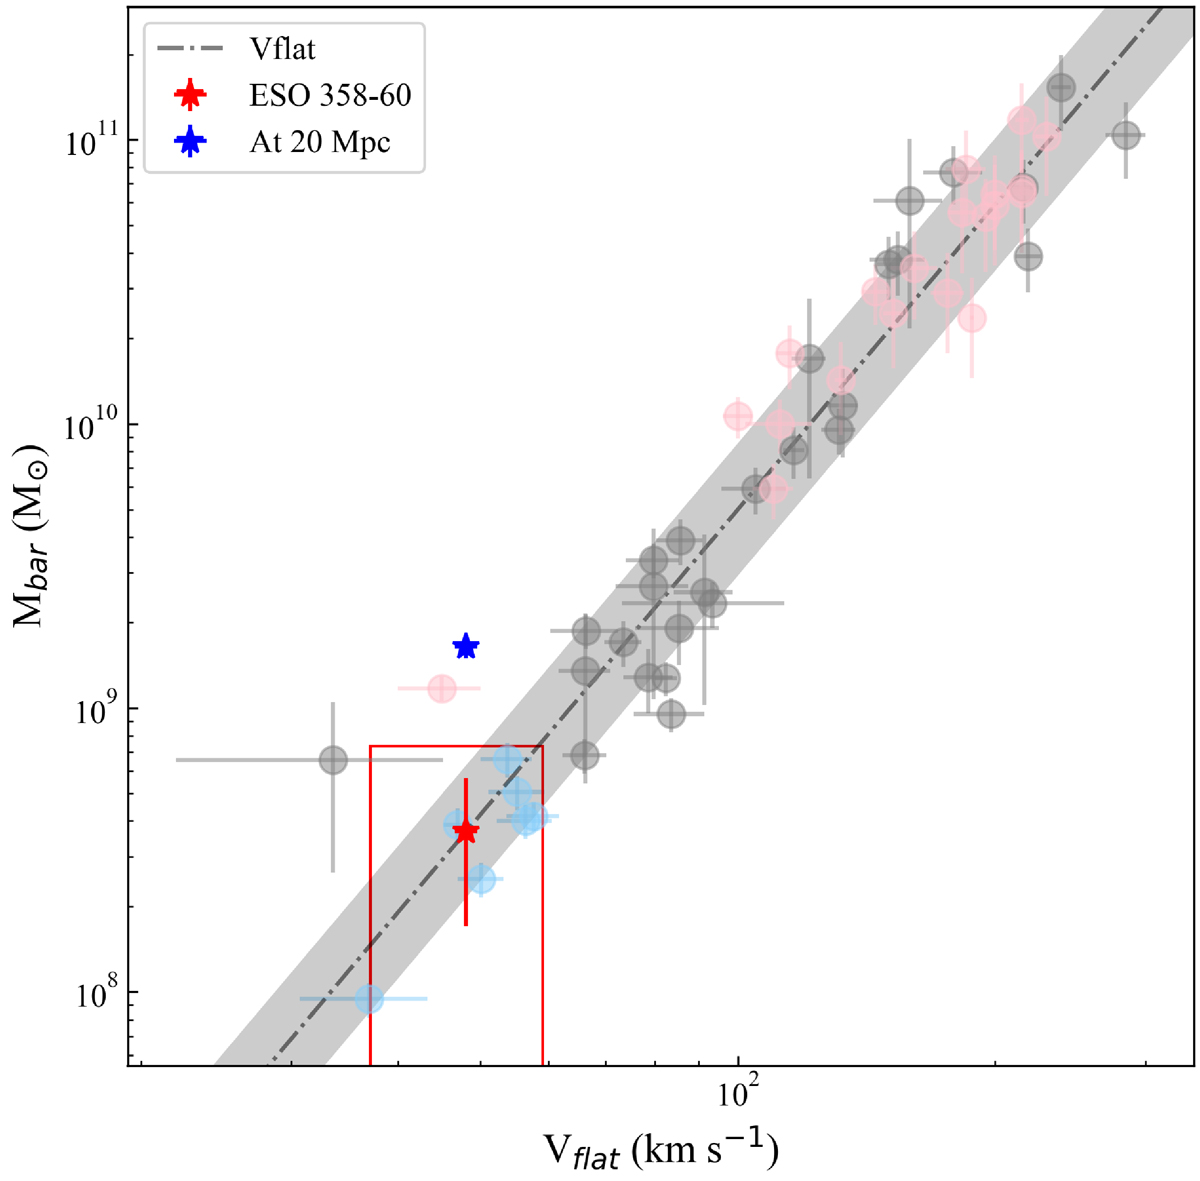
BTFR for the sample of galaxies with redshift-independent distances from SPARC (gray+blue points; Lelli et al. 2016, 2019) supplemented with galaxies from Ponomareva et al. (2016, 2018, red points). The dashed line indicates the relation fitted for Vflat, with the shaded gray area representing the observed vertical scatter. The stars indicate ESO 358-60 on the relation for the best-fit model (red) and at a distance of 20 ± 1 Mpc (blue). The red box is determined by its top-right corner, where ESO 358-60 is positioned on the relation when using the upper limit derived from the rising RC model.
Current usage metrics show cumulative count of Article Views (full-text article views including HTML views, PDF and ePub downloads, according to the available data) and Abstracts Views on Vision4Press platform.
Data correspond to usage on the plateform after 2015. The current usage metrics is available 48-96 hours after online publication and is updated daily on week days.
Initial download of the metrics may take a while.