Fig. 6.

Download original image
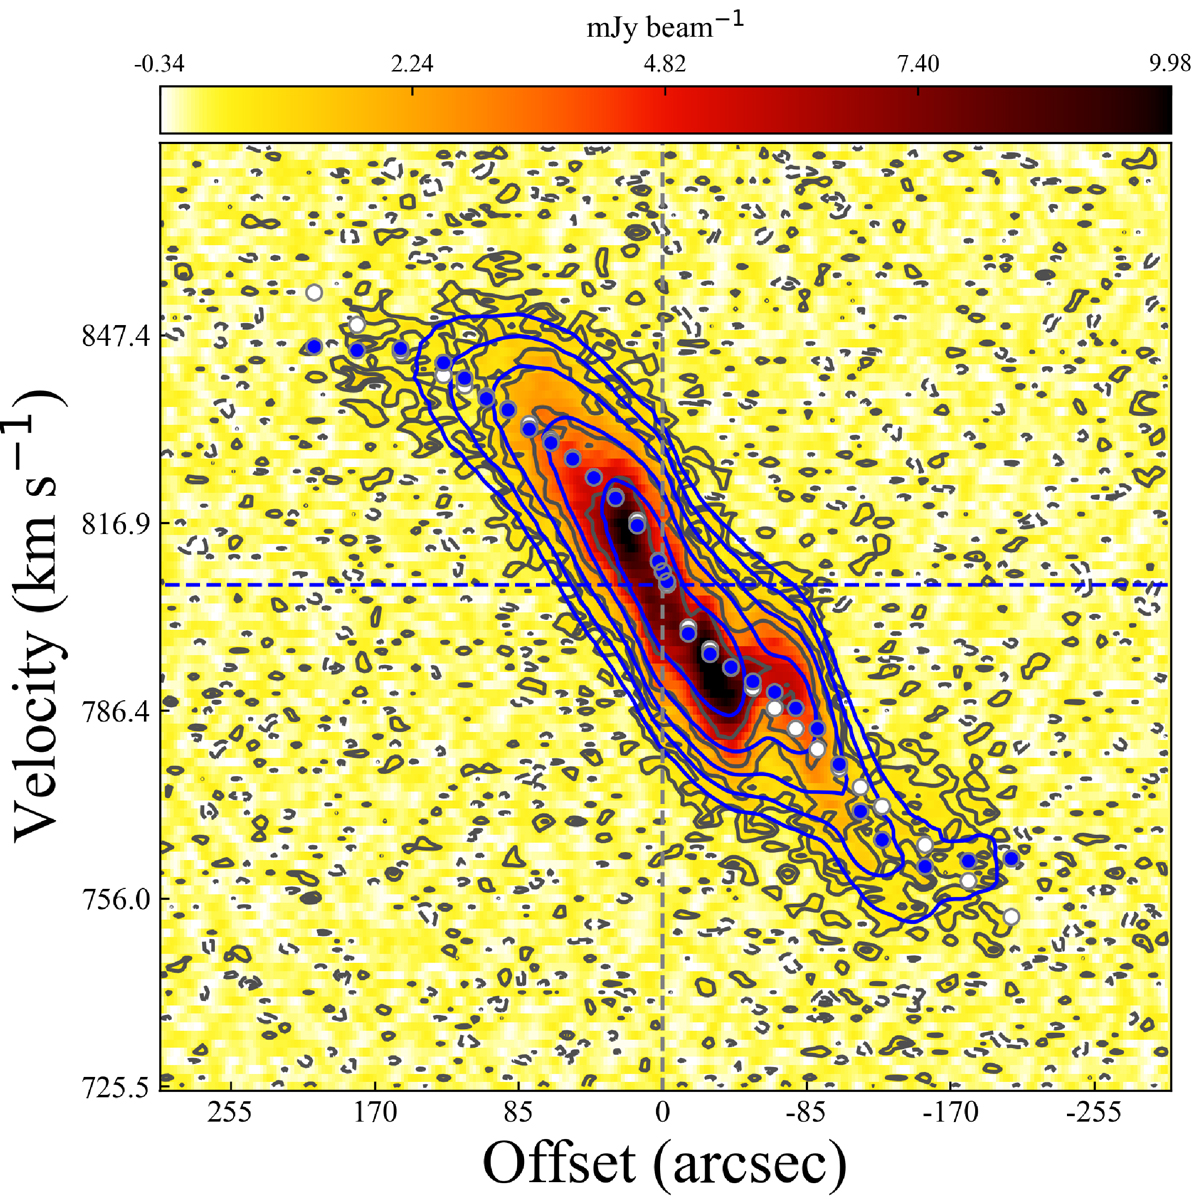
PV diagram along the major axis. Gray contours and the color scale show the data, and blue contours show the best-fit model. Contours are at 1.5, 3, 6, 12, 24 × σ with σ = 0.24 mJy beam−1 (3.2 × 1018 cm−2 in a channel). The dashed gray line indicates the spatial fitted center, and the dashed colored line indicates the fitted systemic velocity of the best-fit model. The blue circles indicate the Vobs = Vrot × sin(i) of the best-fit model, and the white circles the same for the rising model (see text). To be concurrent with the right ascension, offsets are decreasing from left to right.
Current usage metrics show cumulative count of Article Views (full-text article views including HTML views, PDF and ePub downloads, according to the available data) and Abstracts Views on Vision4Press platform.
Data correspond to usage on the plateform after 2015. The current usage metrics is available 48-96 hours after online publication and is updated daily on week days.
Initial download of the metrics may take a while.


