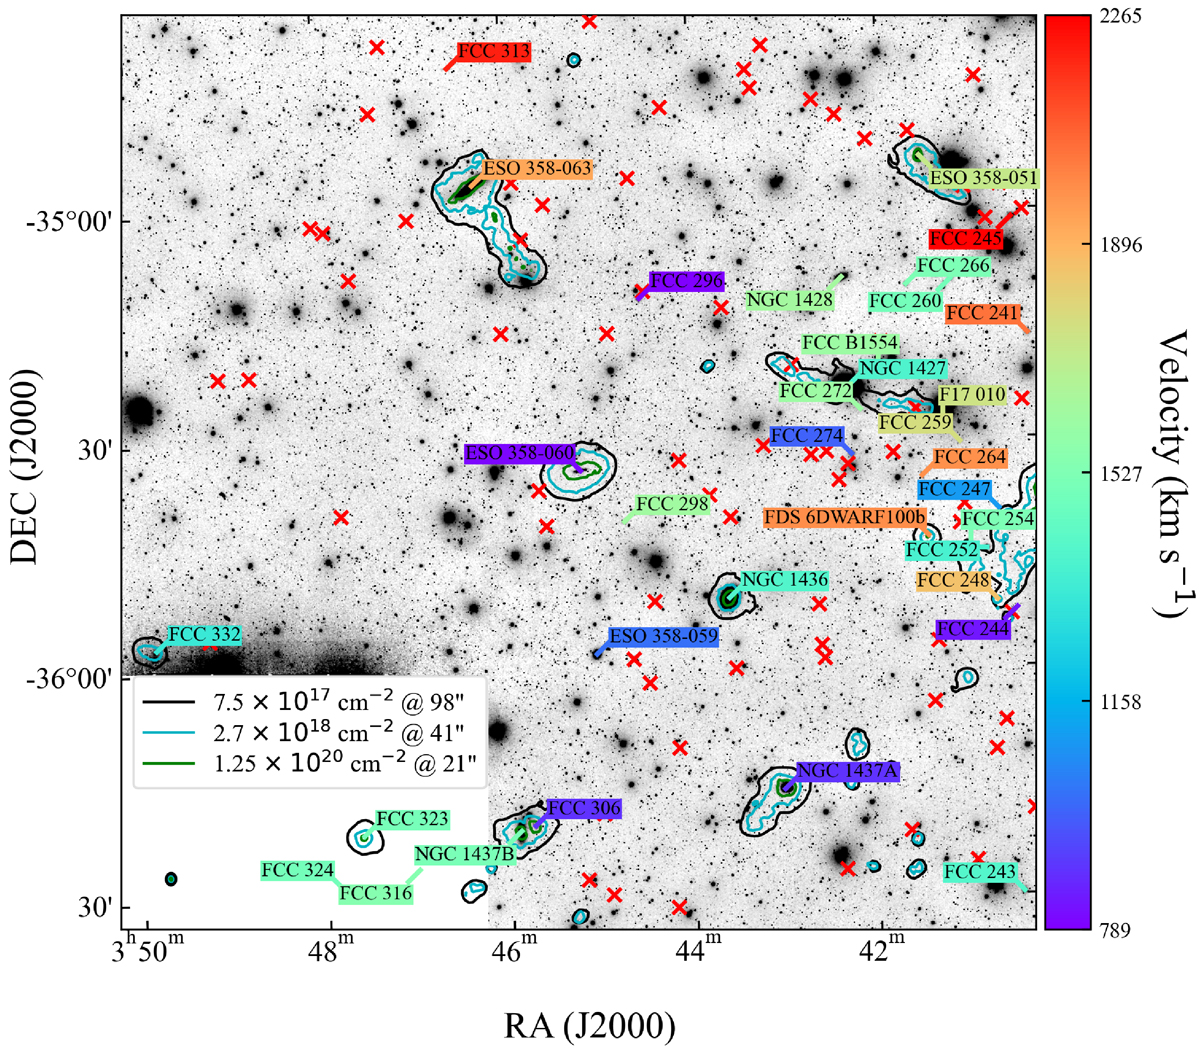
Fig. 4.
Download original image
g′-band image of the 2 deg2 surrounding ESO 358-60 from the FDS (Iodice et al. 2016; Venhola et al. 2018) overlaid with the lowest reliable contours (3σ) of the 98″ and 41″ resolutions of the MFS. For the 21″ resolution, we plot the contour corresponding to ∼1 M⊙ pc−2. The beams are displayed in the bottom-left corner. All galaxies that are spectroscopically confirmed in the field are labeled, and the background color of the label indicates the systemic velocity of the system. The color bar on the right shows the correspondence between color and velocity. Galaxies identified in the FDS, but not spectroscopically confirmed, are marked with a red x.
Current usage metrics show cumulative count of Article Views (full-text article views including HTML views, PDF and ePub downloads, according to the available data) and Abstracts Views on Vision4Press platform.
Data correspond to usage on the plateform after 2015. The current usage metrics is available 48-96 hours after online publication and is updated daily on week days.
Initial download of the metrics may take a while.