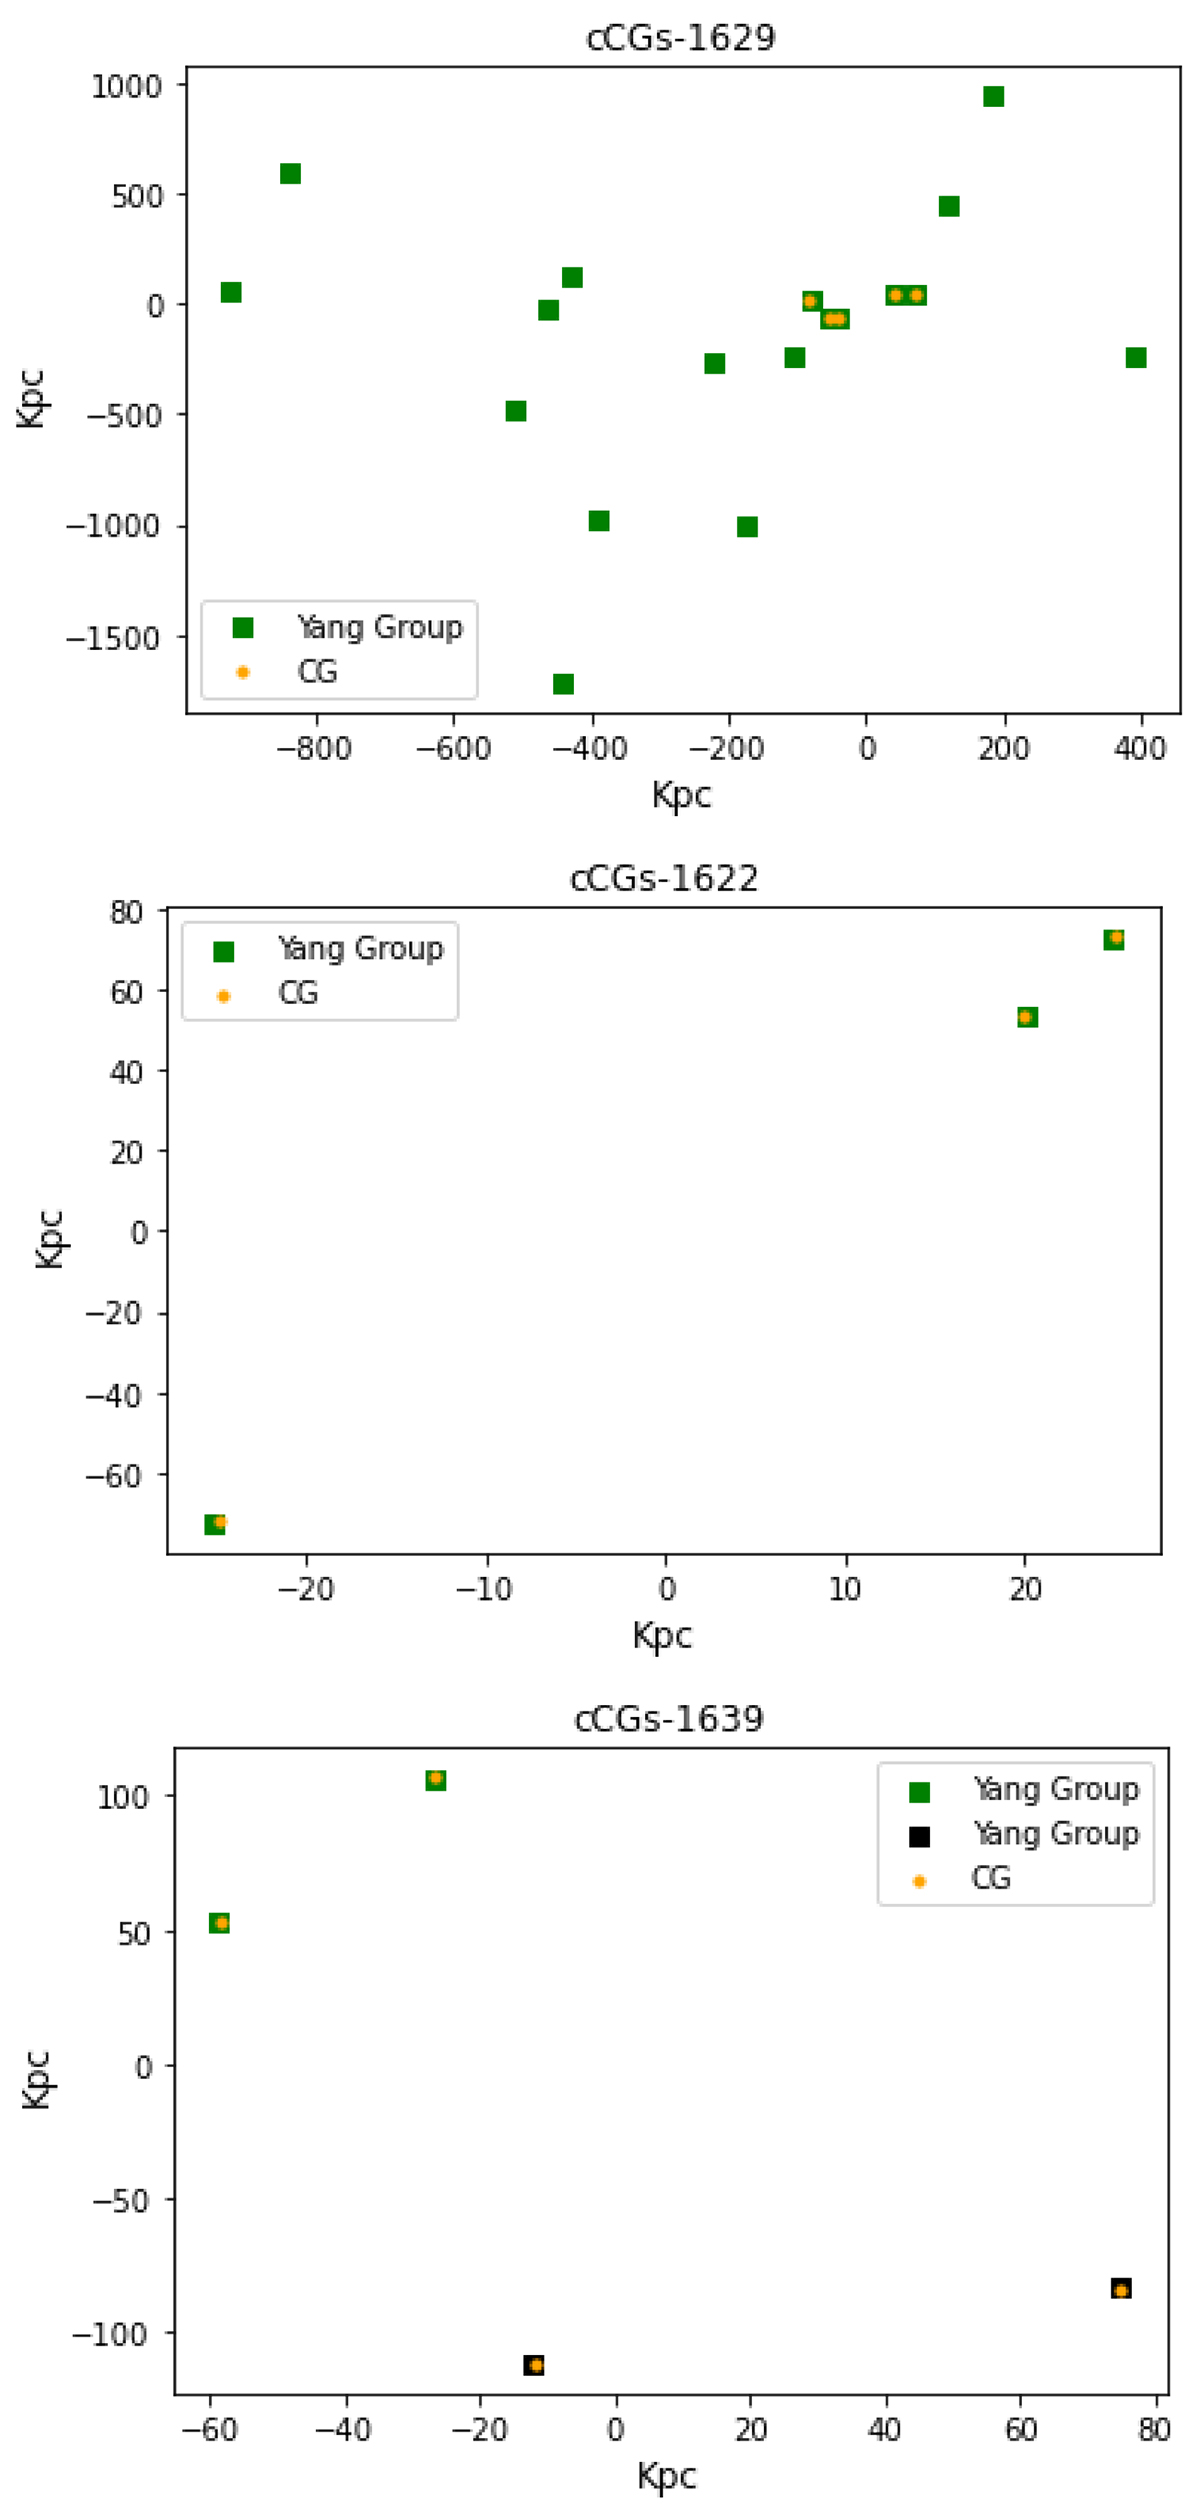
Fig. 8.
Download original image
Visual representation of the spatial distribution and membership classification of CGs in different environments. The top panel shows a non-isolated CG (cCGs-1629), where the galaxies identified as part of the CG (orange points) are within a larger group (green squares), indicating their association with a major structure as reported by Yang et al. (2007). The middle panel illustrates an isolated CG (cCGs-1622), where the galaxies correspond exactly with those identified by Yang et al. (2007), confirming no additional members. In the bottom panel, a split CG is shown, where the galaxies in the CG (orange points) belong to different groups according to Yang et al. (2007), specifically forming pairs (green and black squares), highlighting discrepancies in membership due to differing selection criteria.
Current usage metrics show cumulative count of Article Views (full-text article views including HTML views, PDF and ePub downloads, according to the available data) and Abstracts Views on Vision4Press platform.
Data correspond to usage on the plateform after 2015. The current usage metrics is available 48-96 hours after online publication and is updated daily on week days.
Initial download of the metrics may take a while.