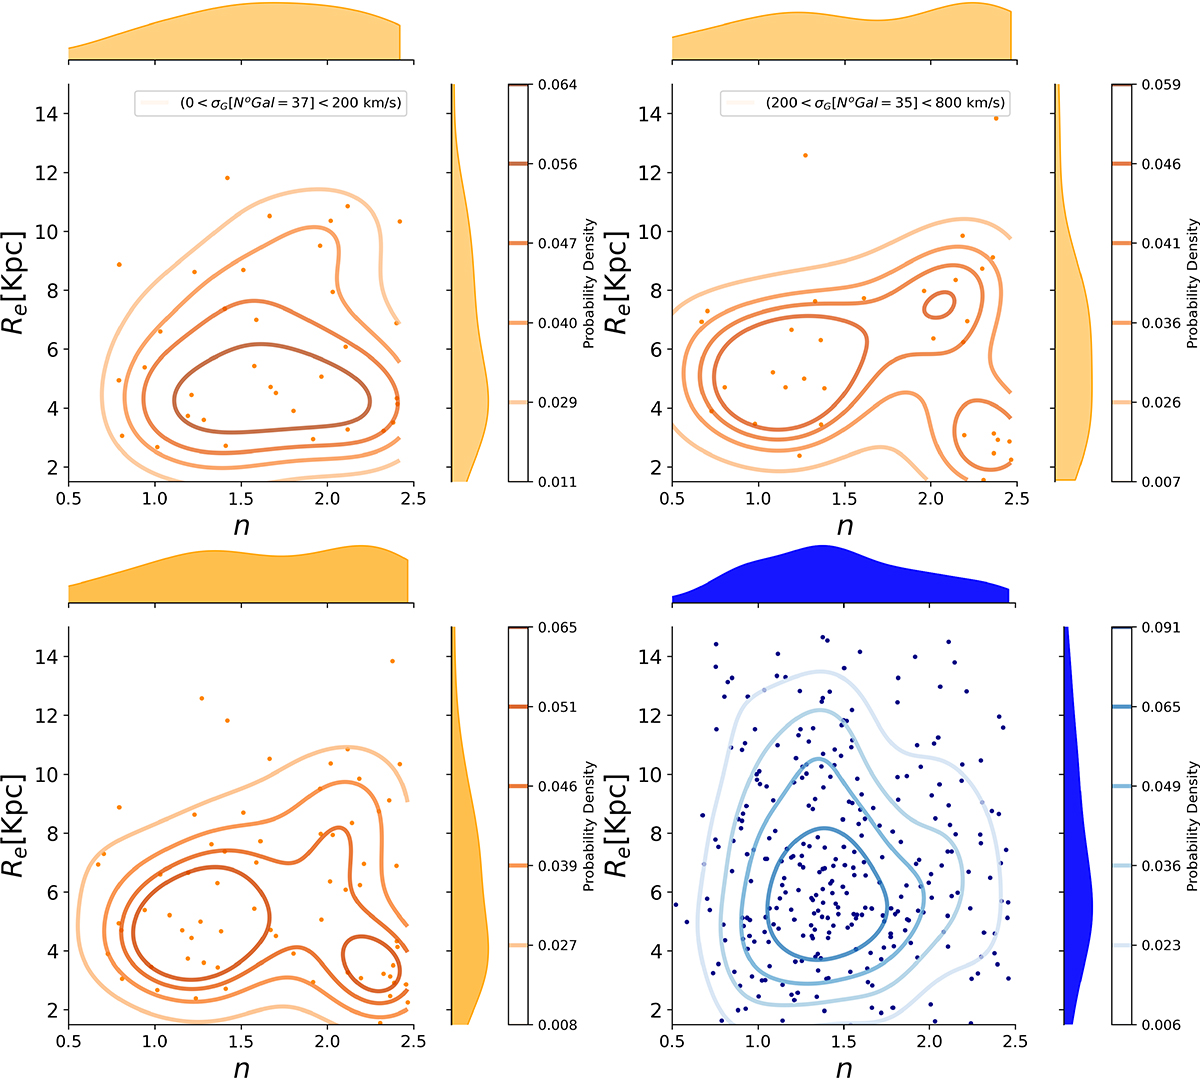
Fig. 6.
Download original image
Effective radius-Sérsic index plane for transition galaxies in the r-band. Top panels show orange contours for galaxies in CGs, divided by velocity dispersion bins, with the number of galaxies indicated above each panel. Bottom panels display transition galaxies for all CGs (orange contours, left) and for the control sample (blue contours, right).
Current usage metrics show cumulative count of Article Views (full-text article views including HTML views, PDF and ePub downloads, according to the available data) and Abstracts Views on Vision4Press platform.
Data correspond to usage on the plateform after 2015. The current usage metrics is available 48-96 hours after online publication and is updated daily on week days.
Initial download of the metrics may take a while.