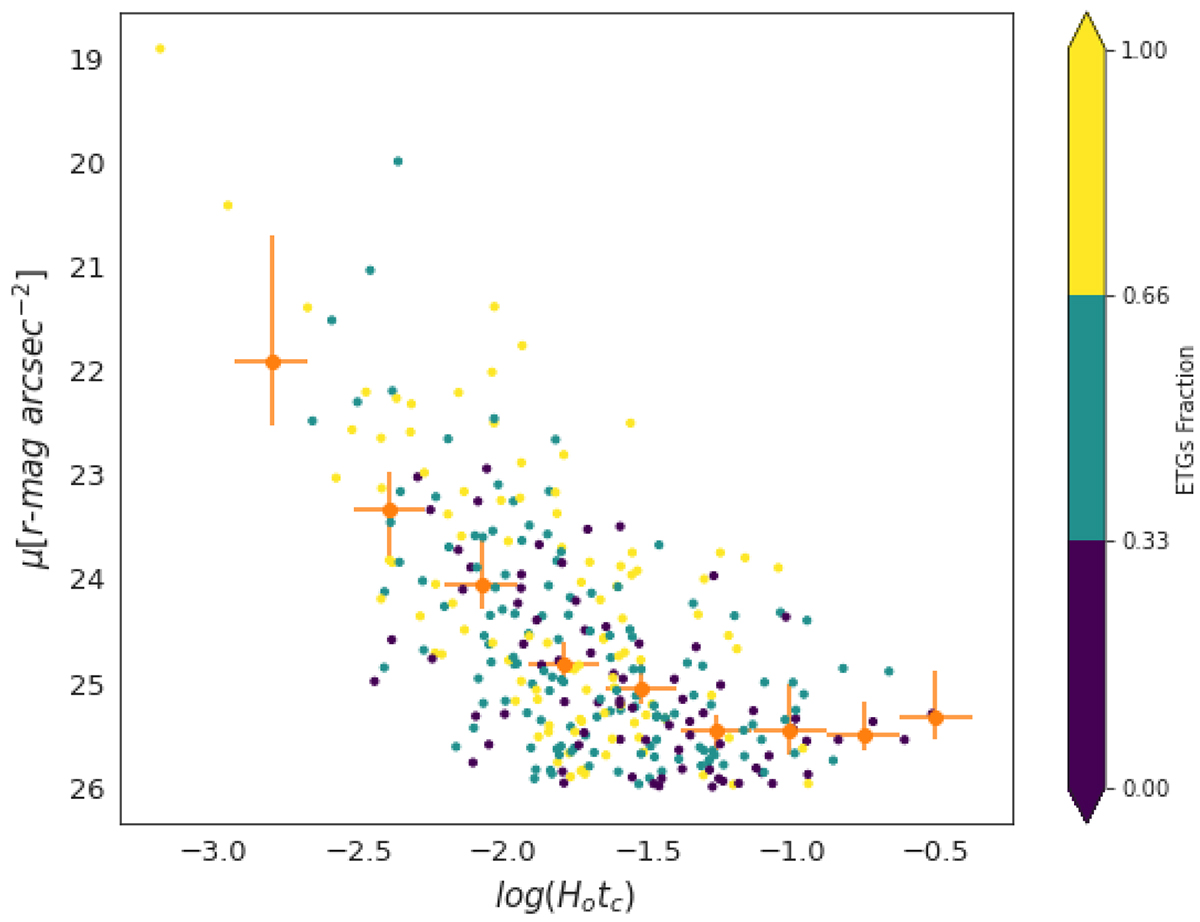
Fig. 4.
Download original image
Dimensionless crossing time versus compactness for CGs. The points represent the values for each CG, with the colour of the points indicating the fraction of ETGs. The orange circles with bars represent the median values per bin of crossing times, with the bars on the x-axis indicating bin sizes and those on the y-axis showing the 90% confidence interval.
Current usage metrics show cumulative count of Article Views (full-text article views including HTML views, PDF and ePub downloads, according to the available data) and Abstracts Views on Vision4Press platform.
Data correspond to usage on the plateform after 2015. The current usage metrics is available 48-96 hours after online publication and is updated daily on week days.
Initial download of the metrics may take a while.