Fig. 2.
Download original image
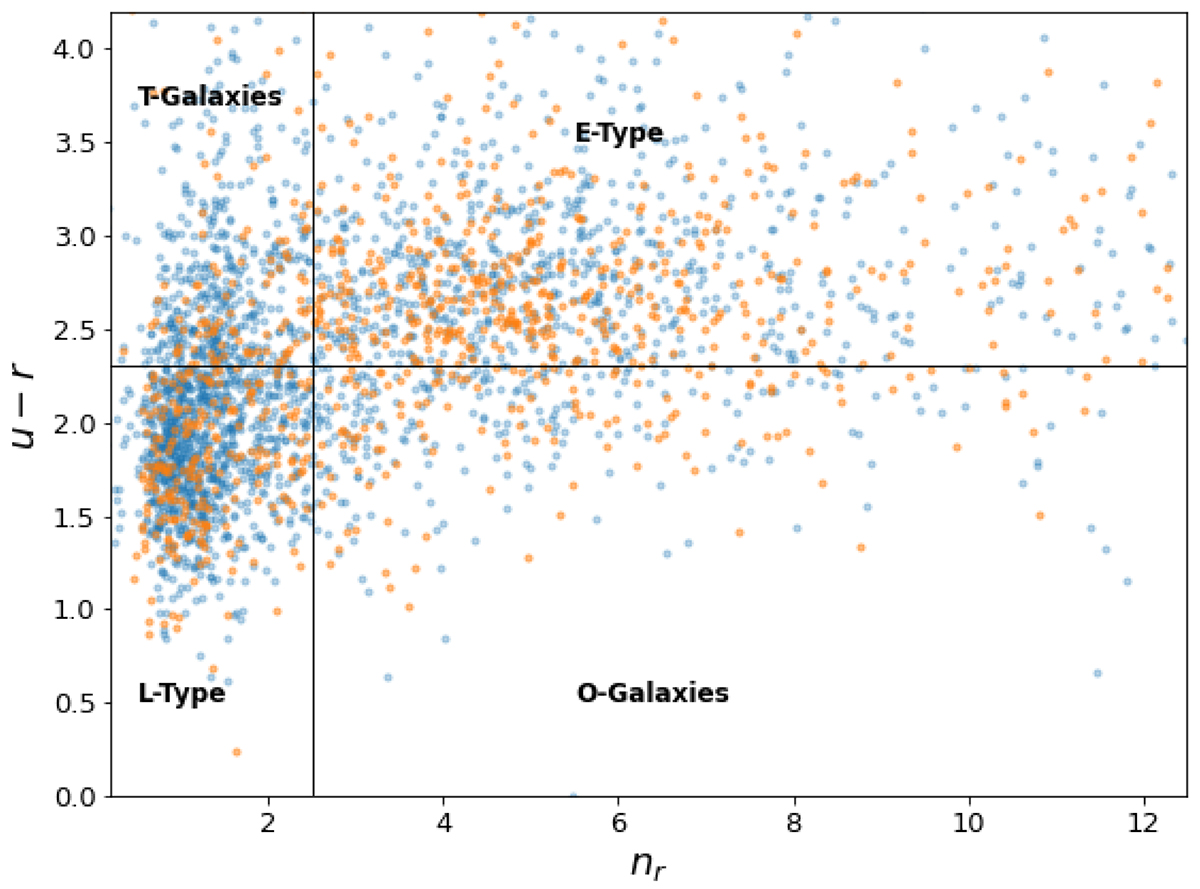
Morphology classification using (u − r)0 rest-frame colour and Sérsic index in the r-band. The vertical line indicates nr = 2.5, and the horizontal line indicates (u − r)0 = 2.3. This classification was proposed by Vika et al. (2015). The blue dots represent galaxies in CGs, while the orange dots represent galaxies in the control sample.
Current usage metrics show cumulative count of Article Views (full-text article views including HTML views, PDF and ePub downloads, according to the available data) and Abstracts Views on Vision4Press platform.
Data correspond to usage on the plateform after 2015. The current usage metrics is available 48-96 hours after online publication and is updated daily on week days.
Initial download of the metrics may take a while.