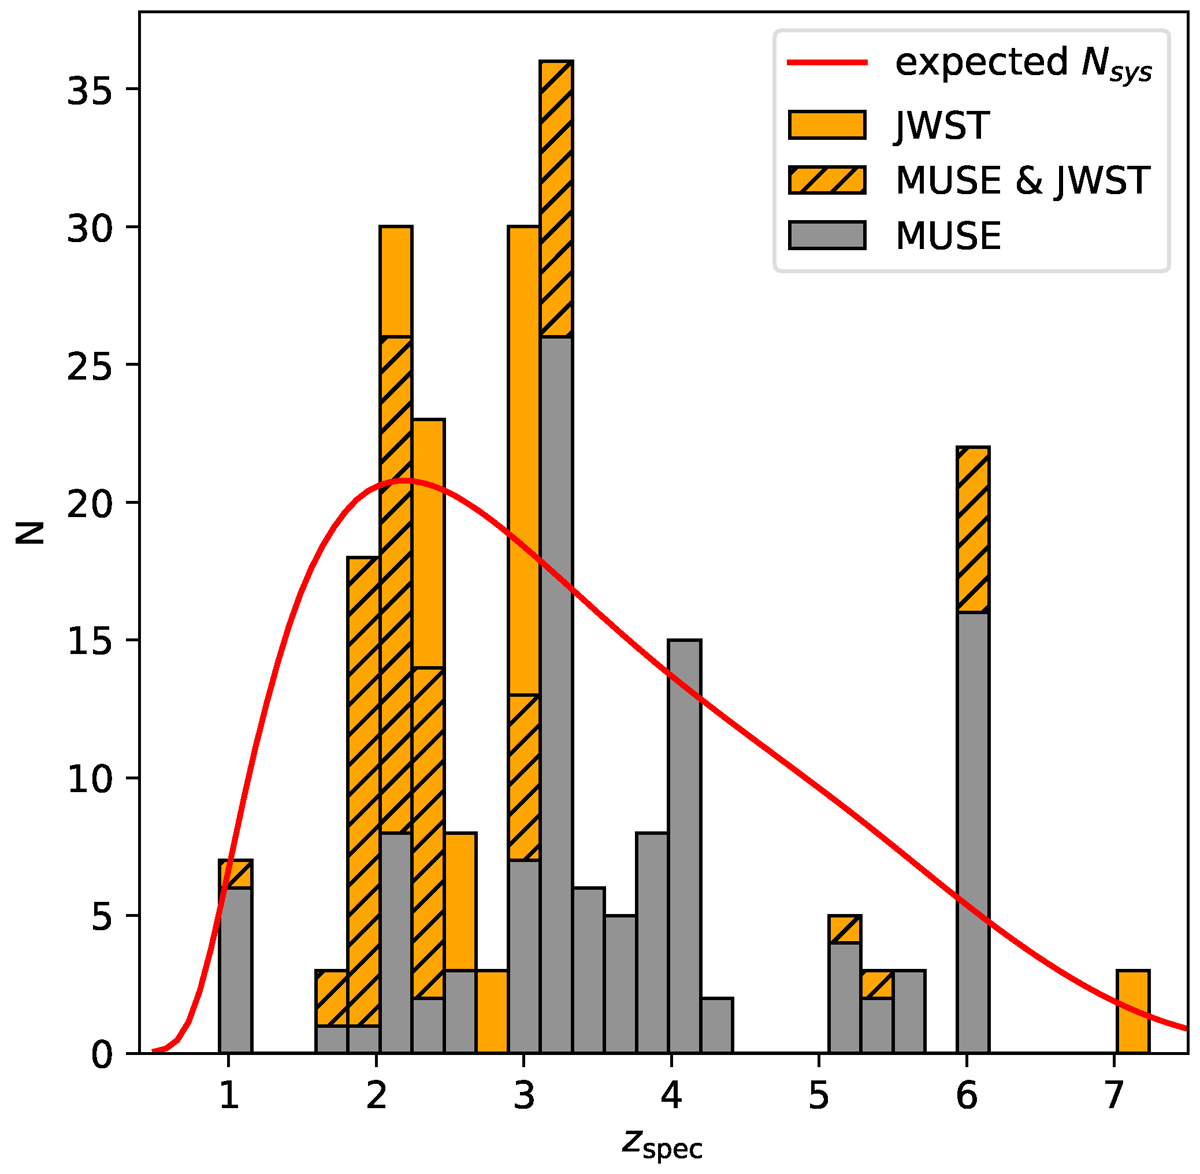
Fig. 7.
Download original image
Redshift distribution of multiple images included in our gold catalogue with known spectroscopic redshift. Images for which the spectroscopic redshift was obtained only by MUSE are shown in grey. Images for which we provided spectroscopic redshifts with JWST are shown in orange. Striped regions represent images with both JWST and MUSE redshift measurements. In the histogram, each multiple image is counted once (i.e. different multiply lensed clumps are not considered separately). The red solid line represents the expected redshift distribution of multiple-image systems, considering the redshift distribution of sources in the field and multiply imaged area in the source plane, which increases with redshift.
Current usage metrics show cumulative count of Article Views (full-text article views including HTML views, PDF and ePub downloads, according to the available data) and Abstracts Views on Vision4Press platform.
Data correspond to usage on the plateform after 2015. The current usage metrics is available 48-96 hours after online publication and is updated daily on week days.
Initial download of the metrics may take a while.