Fig. 6.
Download original image
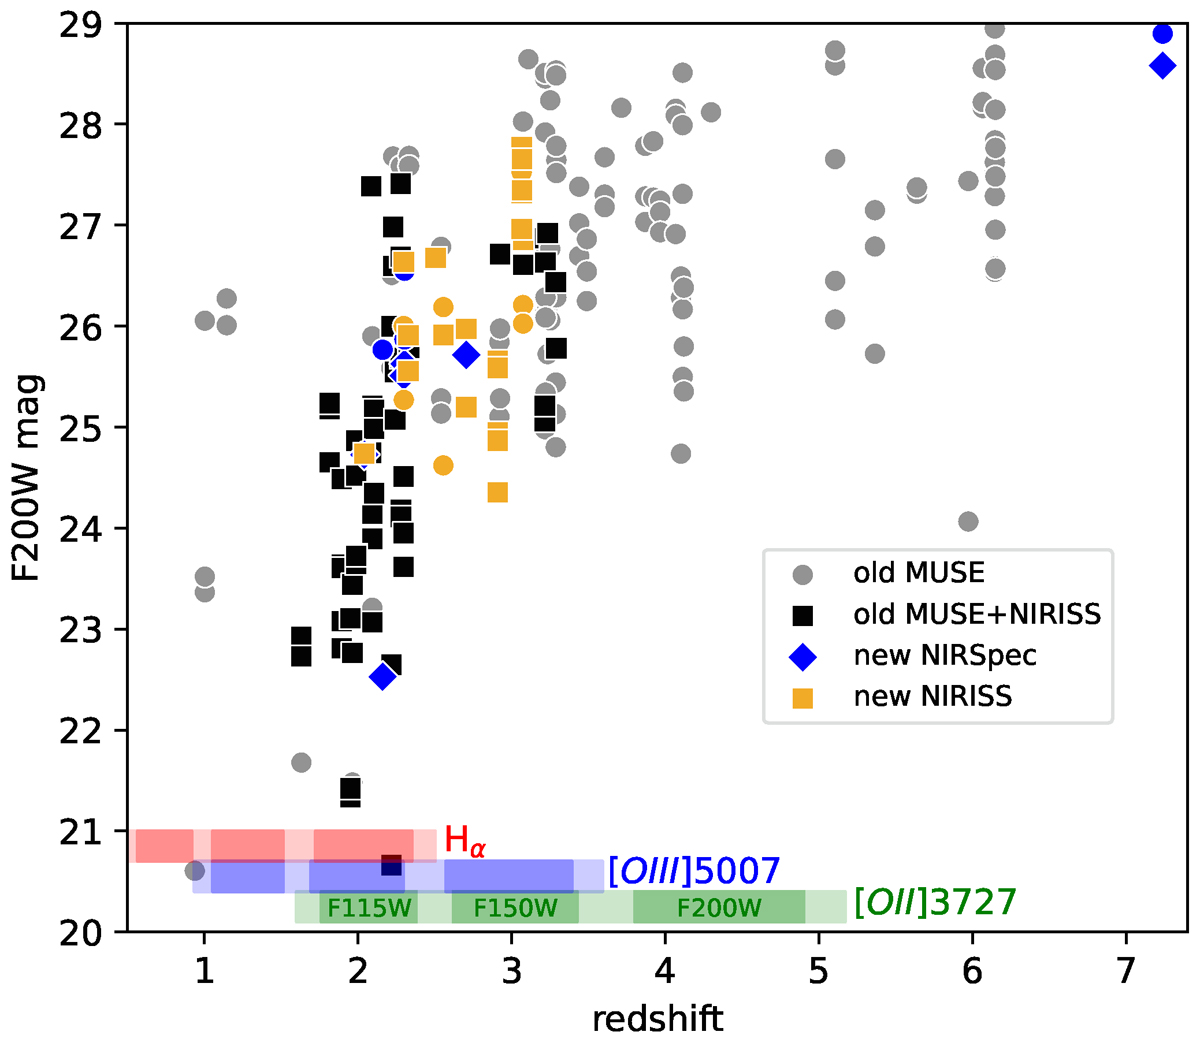
Redshift and F200W magnitude of multiple images in our gold category with known spectroscopic redshifts. Grey and black points represent known images with MUSE redshifts. For black squares, we also obtained NIRISS redshifts. Gold squares represent newly identified images for which we could obtain NIRISS redshift. Blue diamonds represent new images without NIRISS but with NIRSpec redshift. Images for which the redshift could not be reliably measured but with measured system redshift from other images with NIRISS or NIRSpec are marked with gold and blue circles, respectively. Each multiple image is considered once (i.e. different clumps are not considered separately). The coloured bands at the bottom of the figure represent redshift ranges where some of the most prominent emission lines fall in the wavelength range, covered by each of the three NIRISS grism filters, used in this work. The darker shade of the grism range represents a more sensitive region (see Sect. 2.2).
Current usage metrics show cumulative count of Article Views (full-text article views including HTML views, PDF and ePub downloads, according to the available data) and Abstracts Views on Vision4Press platform.
Data correspond to usage on the plateform after 2015. The current usage metrics is available 48-96 hours after online publication and is updated daily on week days.
Initial download of the metrics may take a while.