Fig. 5.
Download original image
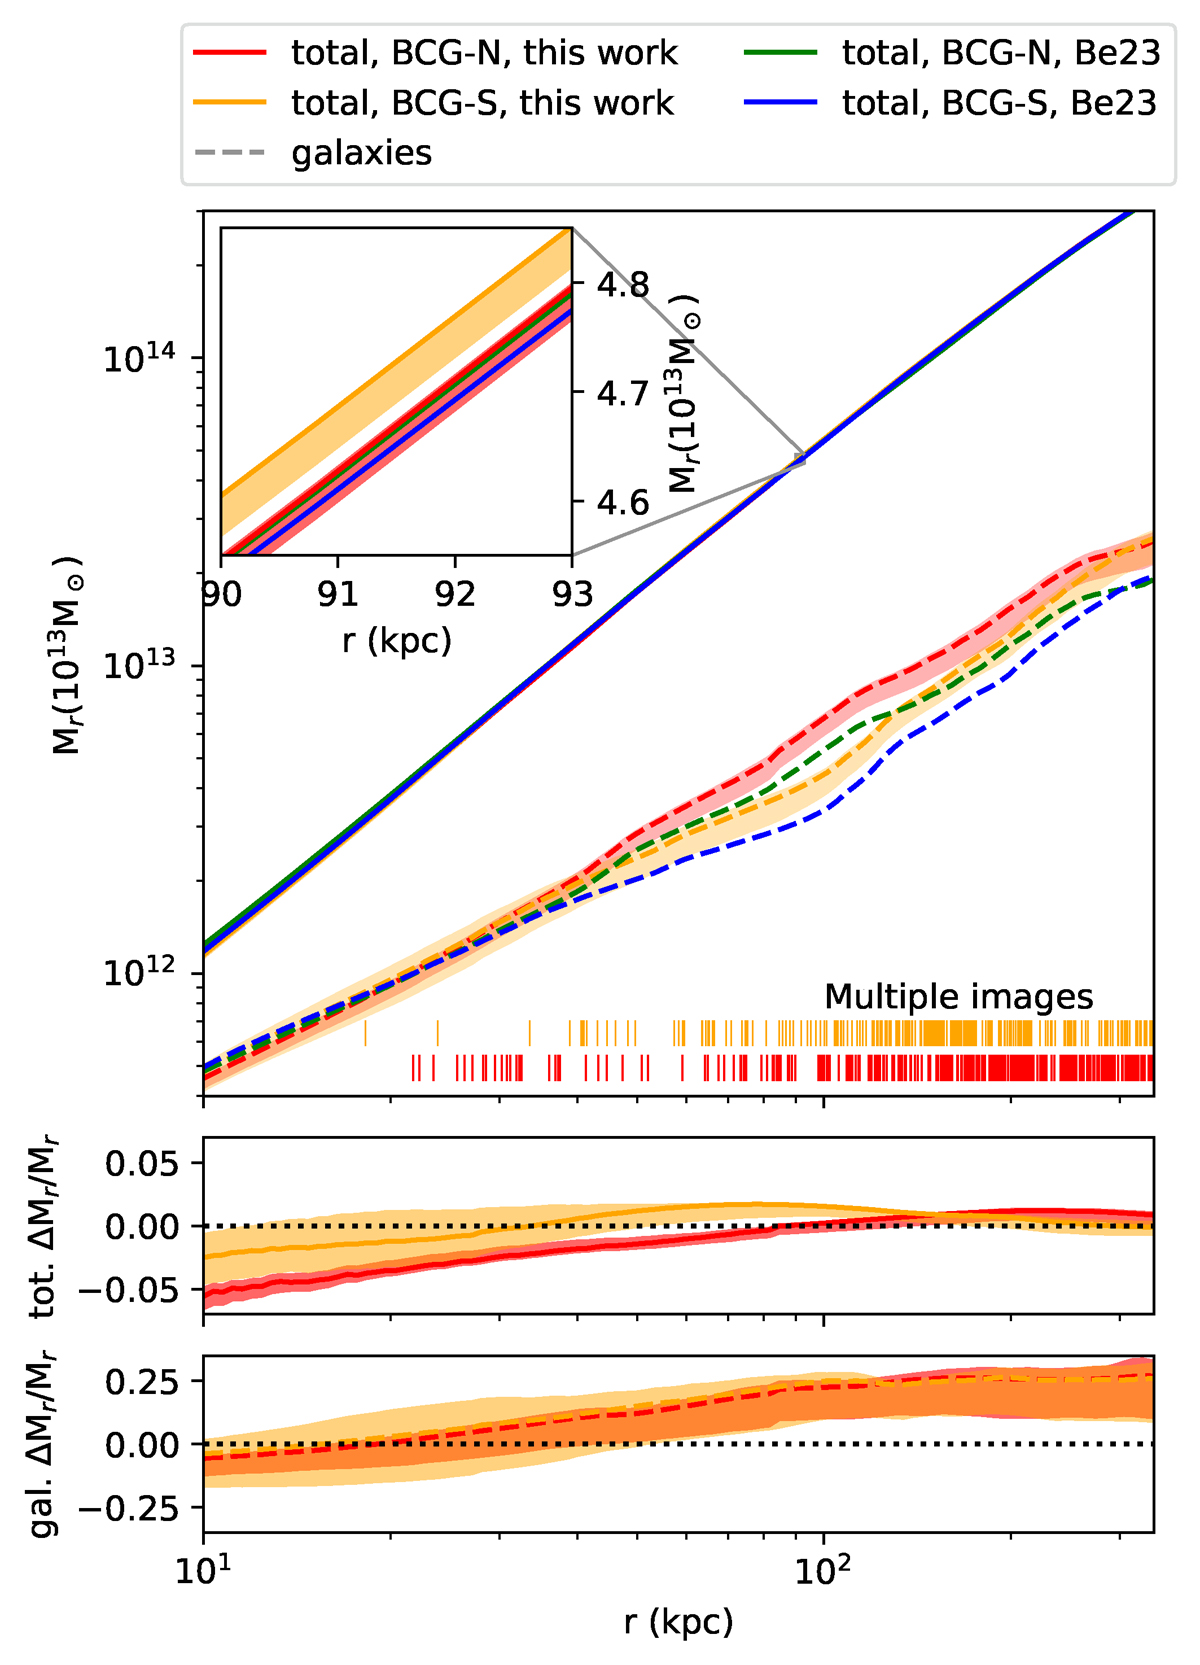
Top: Projected mass Mr in the circular aperture with radius r centred at the northern (red) or the southern BCG (yellow) computed from the best-fit model (solid line) with indicated 68% confidence intervals. The profiles from the best-fit Be23 models are shown in green and blue. The dashed lines represent the cumulative mass Mr contained in the cluster member halos (modelled with the scaling relations). Small vertical bars represent the distances of multiple images from the nothern or southern BCG. Middle: Difference between the total cumulative mass Mr from our model and the Be23 best-fit model relative to our Mr. The confidence intervals are computed from our Mr uncertainty. Bottom: Relative difference between the cumulative mass contained in the cluster member halos from our model and that of Be23.
Current usage metrics show cumulative count of Article Views (full-text article views including HTML views, PDF and ePub downloads, according to the available data) and Abstracts Views on Vision4Press platform.
Data correspond to usage on the plateform after 2015. The current usage metrics is available 48-96 hours after online publication and is updated daily on week days.
Initial download of the metrics may take a while.