Fig. 4.
Download original image
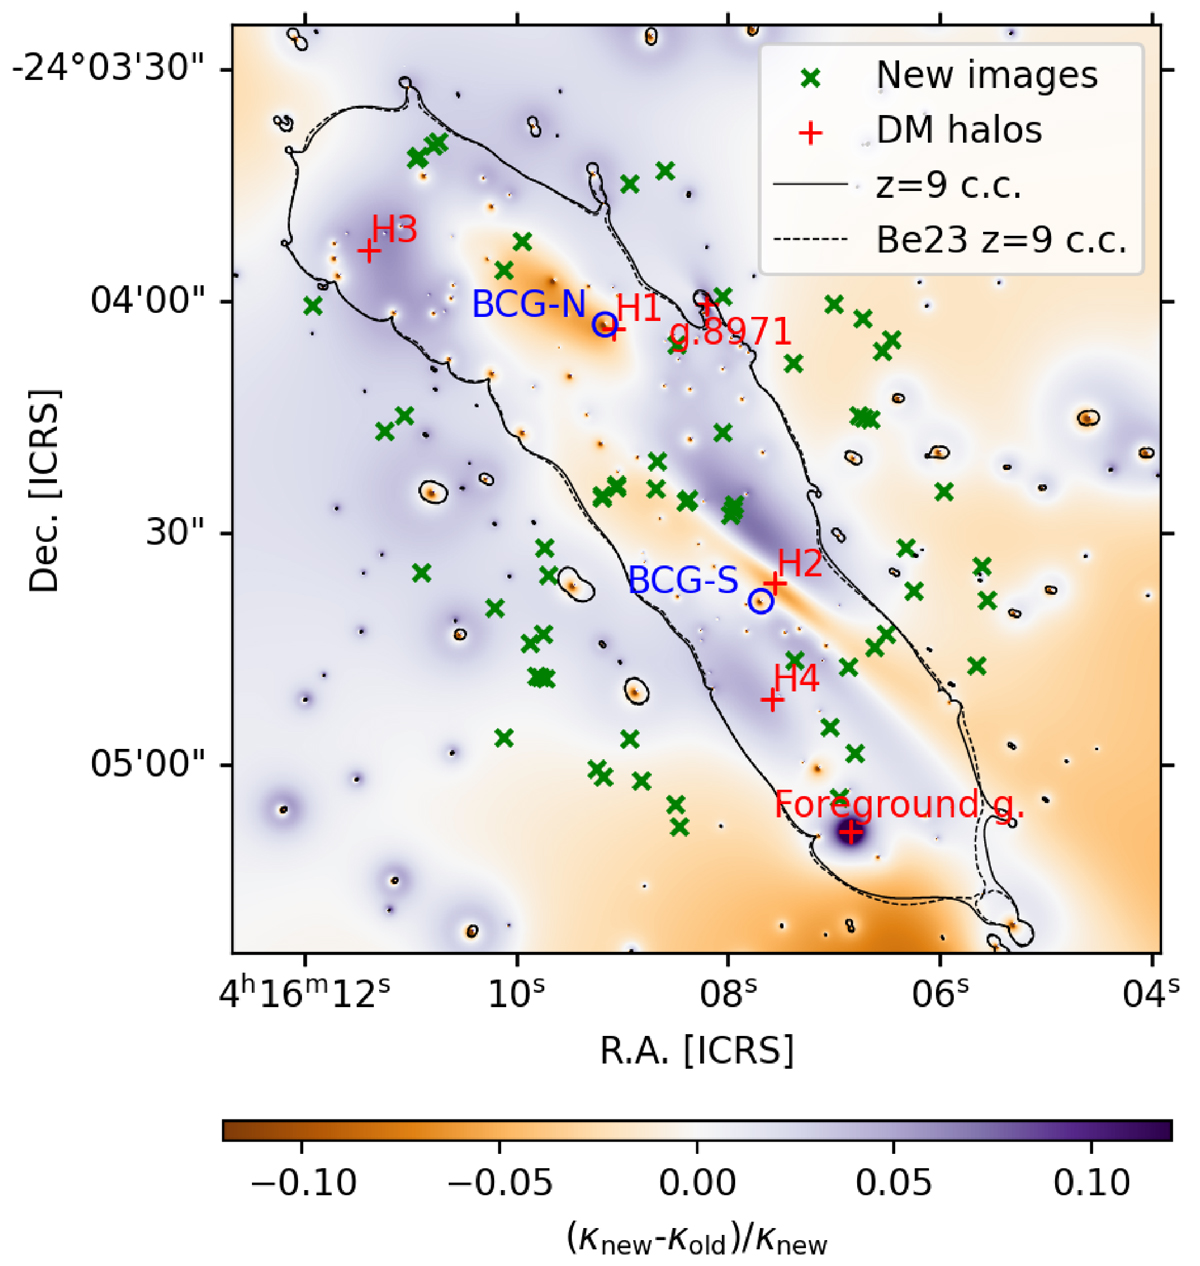
Relative difference between the convergence (κ) from the updated strong lensing model with JWST data and the lens model from Be23, which uses the same parameterisation. The positions of four main cluster halos (H1–H4) and the two galaxies not included in the scaling relations (galaxy 8971 and the foreground galaxy) are marked with red pluses. Positions of the northern and southern BCGs are indicated with blue circles. Green crosses represent new multiple images and old multiple images with new spectroscopic redshifts, not included in the Be23 nor the Di24 catalogues. Black solid and dashed lines represent the tangential (outermost) critical curve for sources at redshift 9, derived from the new and Be23 lensing models, respectively.
Current usage metrics show cumulative count of Article Views (full-text article views including HTML views, PDF and ePub downloads, according to the available data) and Abstracts Views on Vision4Press platform.
Data correspond to usage on the plateform after 2015. The current usage metrics is available 48-96 hours after online publication and is updated daily on week days.
Initial download of the metrics may take a while.