Fig. 2.
Download original image
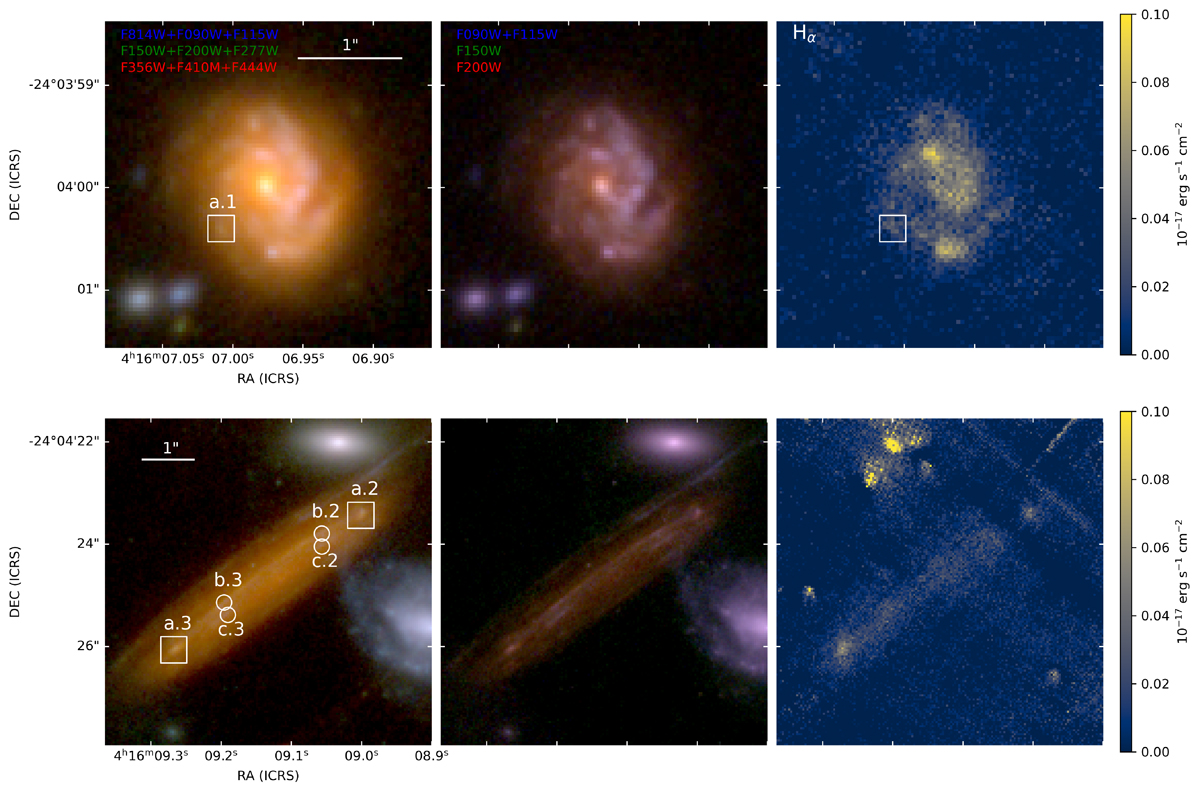
Multiply imaged clumps a, b, and c of system K8. The lower panels show the extended arc, with two counter images of the spiral galaxy shown in the upper panels. The two panels on the left show two RGB combinations of NIRCam images. In the right panel, we show Hα emission line flux obtained from the F200W grism spectra (see Appendix B), which was used to identify image K8a.1.
Current usage metrics show cumulative count of Article Views (full-text article views including HTML views, PDF and ePub downloads, according to the available data) and Abstracts Views on Vision4Press platform.
Data correspond to usage on the plateform after 2015. The current usage metrics is available 48-96 hours after online publication and is updated daily on week days.
Initial download of the metrics may take a while.