Fig. 1.
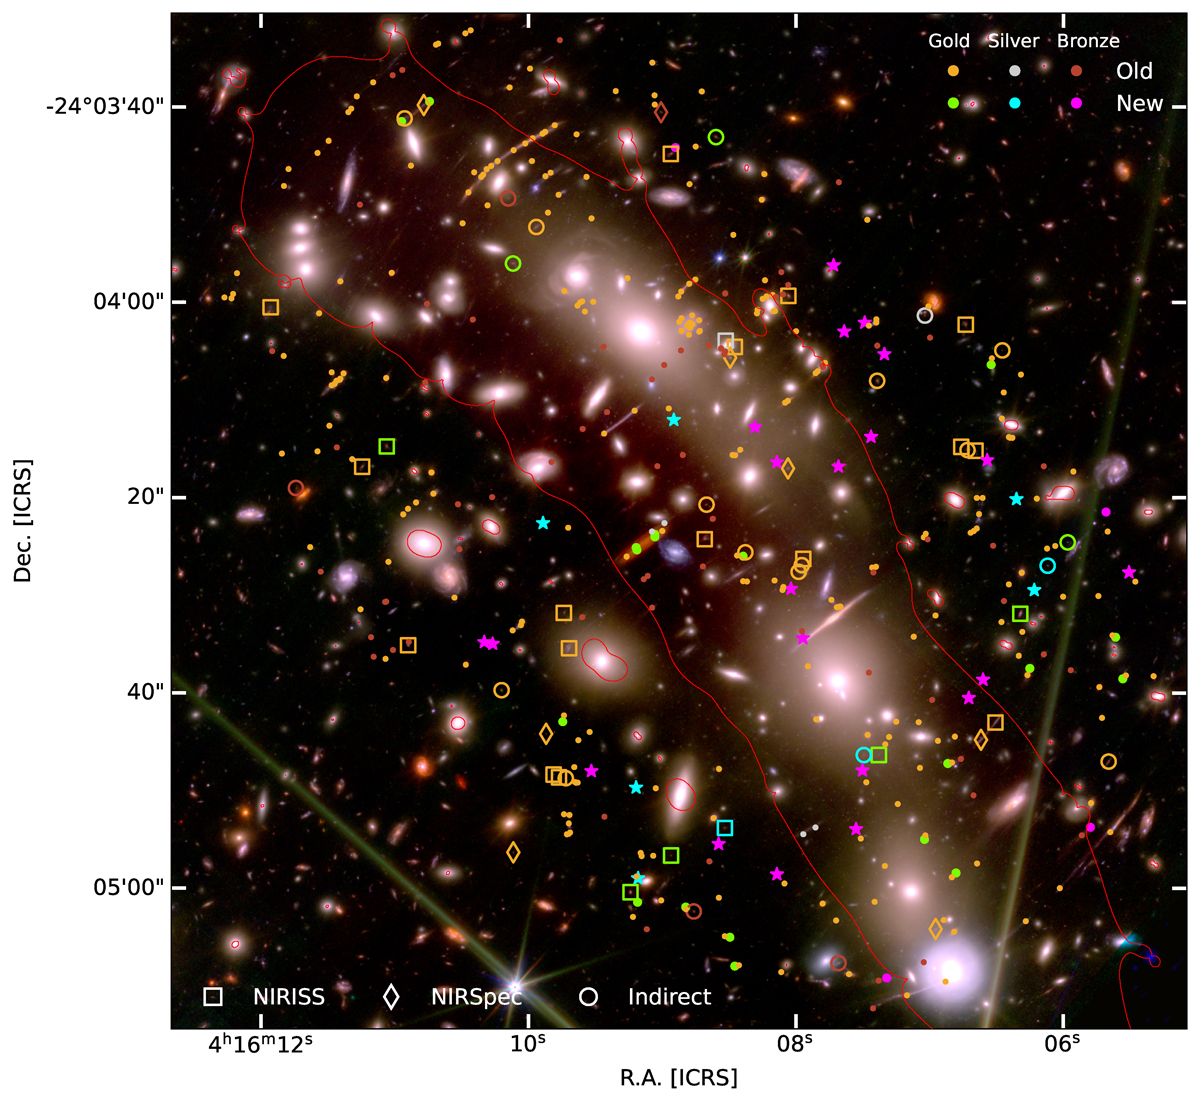
Download original image
RGB image of the central region of MACS0416 with multiple images. For the RGB image, we used several JWST/NIRCam and HST/WCS filters. F277W, F356W, F410M, and F444W are shown in red; F115W, F150W, and F200W are in green; and F814W, F606W, F435W, and F090W are in blue. Newly identified systems or multiply imaged clumps belonging to the gold, silver, or bronze category are shown in green, cyan, or magenta, respectively. Known systems and clumps from Di24 and Be23 are depicted in gold, silver, or bronze, with a colour corresponding to their category in this work. The bronze category also includes quartz images. Squares and diamonds represent images with new spectroscopic redshift, obtained with NIRISS and NIRSpec, respectively. Empty circles represent images for which we could not measure spectroscopic redshift directly but have new spectroscopic redshifts inferred from other images of the system. Stars represent newly identified candidate systems for which we could not obtain spectroscopic redshift. The red solid line represents the tangential (outermost) critical curve from our lensing model for redshift z = 9.
Current usage metrics show cumulative count of Article Views (full-text article views including HTML views, PDF and ePub downloads, according to the available data) and Abstracts Views on Vision4Press platform.
Data correspond to usage on the plateform after 2015. The current usage metrics is available 48-96 hours after online publication and is updated daily on week days.
Initial download of the metrics may take a while.