Fig. A.1
Download original image
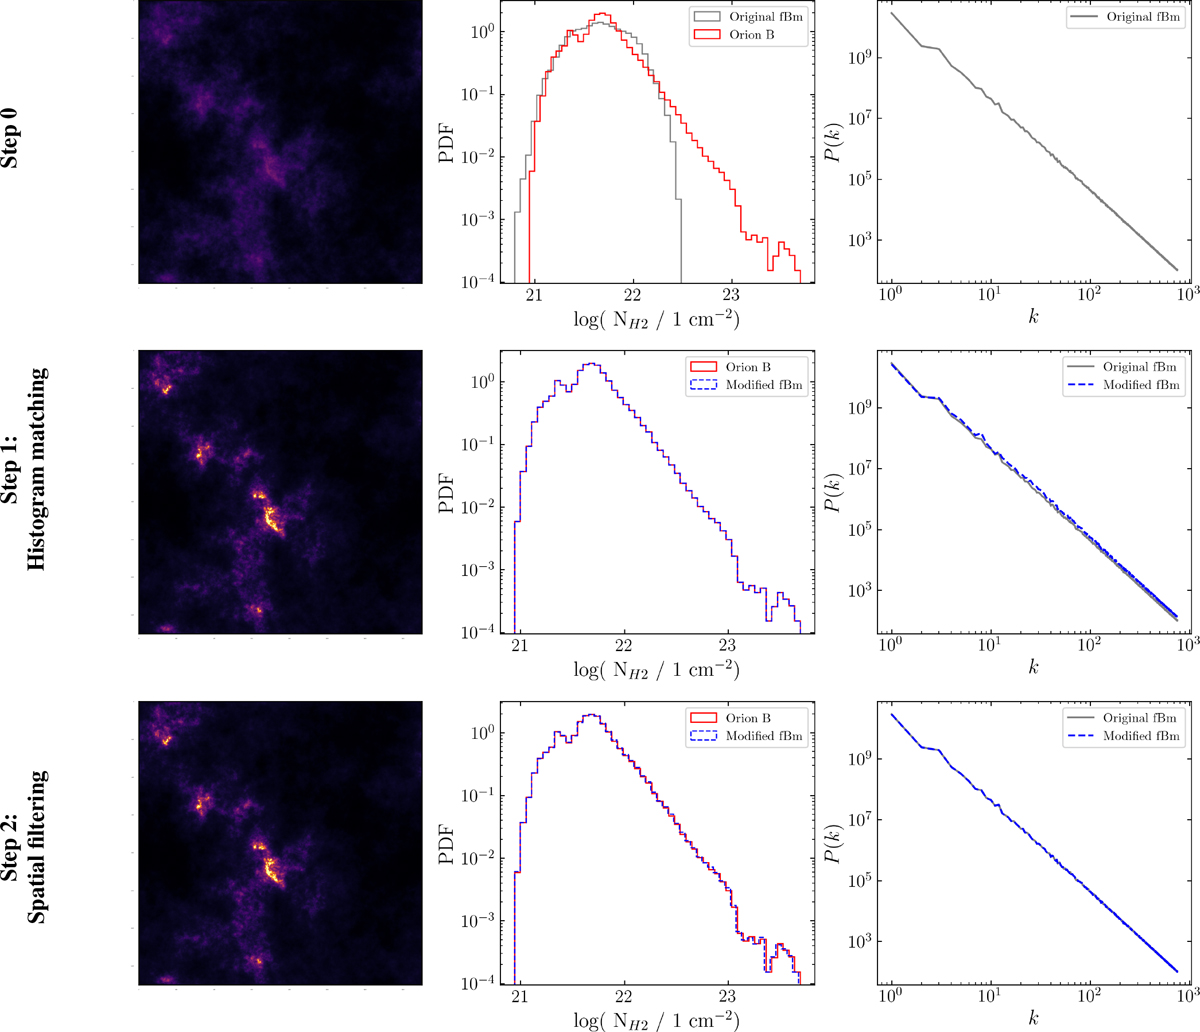
Top: (From left to right) fBm column density field, statistical distribution of the Orion B (red) and fBm (grey) column densities, and power spectrum of the fBm column density field. For illustrative purposes, the fBm distribution has been scaled to have the same mean and standard deviation as the log column density distribution of Orion B, before being exponentiated. Middle: (From left to right) modified fBm column density field resulting from the histogram matching procedure, statistical distribution of the Orion B (red) and modified fBm (dashed blue) column densities, and power spectrum of the fBm (grey) and modified fBm (dashed blue) column density fields. Bottom: (From left to right) modified fBm column density field resulting from the histogram matching procedure and the spatial filtering process, statistical distribution of the Orion B (red) and modified fBm (dashed blue) column densities, and power spectrum of the fBm (grey) and modified fBm (dashed blue) column density fields.
Current usage metrics show cumulative count of Article Views (full-text article views including HTML views, PDF and ePub downloads, according to the available data) and Abstracts Views on Vision4Press platform.
Data correspond to usage on the plateform after 2015. The current usage metrics is available 48-96 hours after online publication and is updated daily on week days.
Initial download of the metrics may take a while.