Fig. 7
Download original image
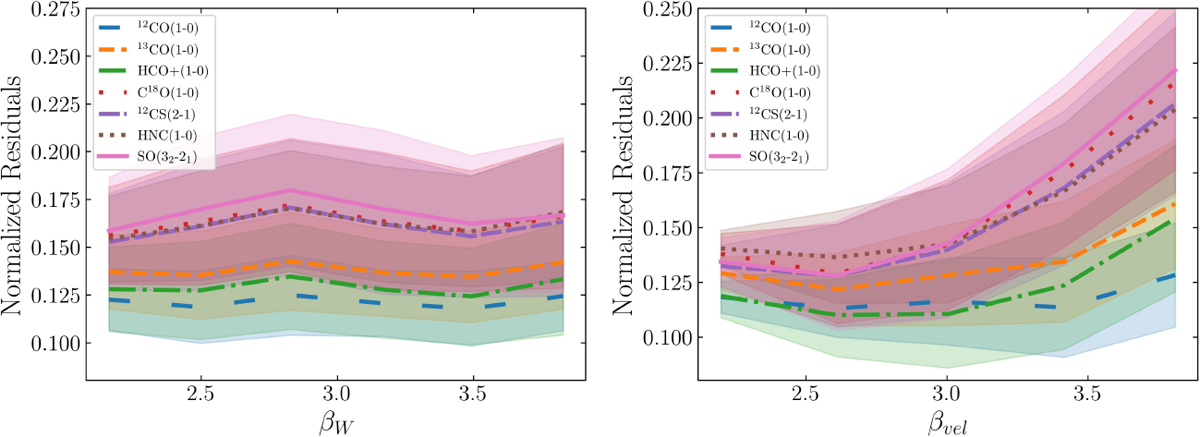
Left: residuals of a Gaussian fit of the beam-average line profiles, as a function of the sub-beam column density field βW index. The sample of 1000 toy clouds is divided in eight equally sized bins of column density field βW index. The full lines and filled range show the mean and standard deviation of the bins. Each colour represents a different emission line. Right: residuals of a Gaussian fit of the beam-average line profiles, as a function of the sub-beam velocity field βv index, in a similar fashion to the left plot.
Current usage metrics show cumulative count of Article Views (full-text article views including HTML views, PDF and ePub downloads, according to the available data) and Abstracts Views on Vision4Press platform.
Data correspond to usage on the plateform after 2015. The current usage metrics is available 48-96 hours after online publication and is updated daily on week days.
Initial download of the metrics may take a while.